Request Logs
ZenMux provides a comprehensive logging system to help you monitor and analyze all API call records in real time. With logging, you can review detailed information for each request—including token usage, cost, performance metrics, and more—so you can better optimize your application and control costs.
Viewing Logs
Logs UI
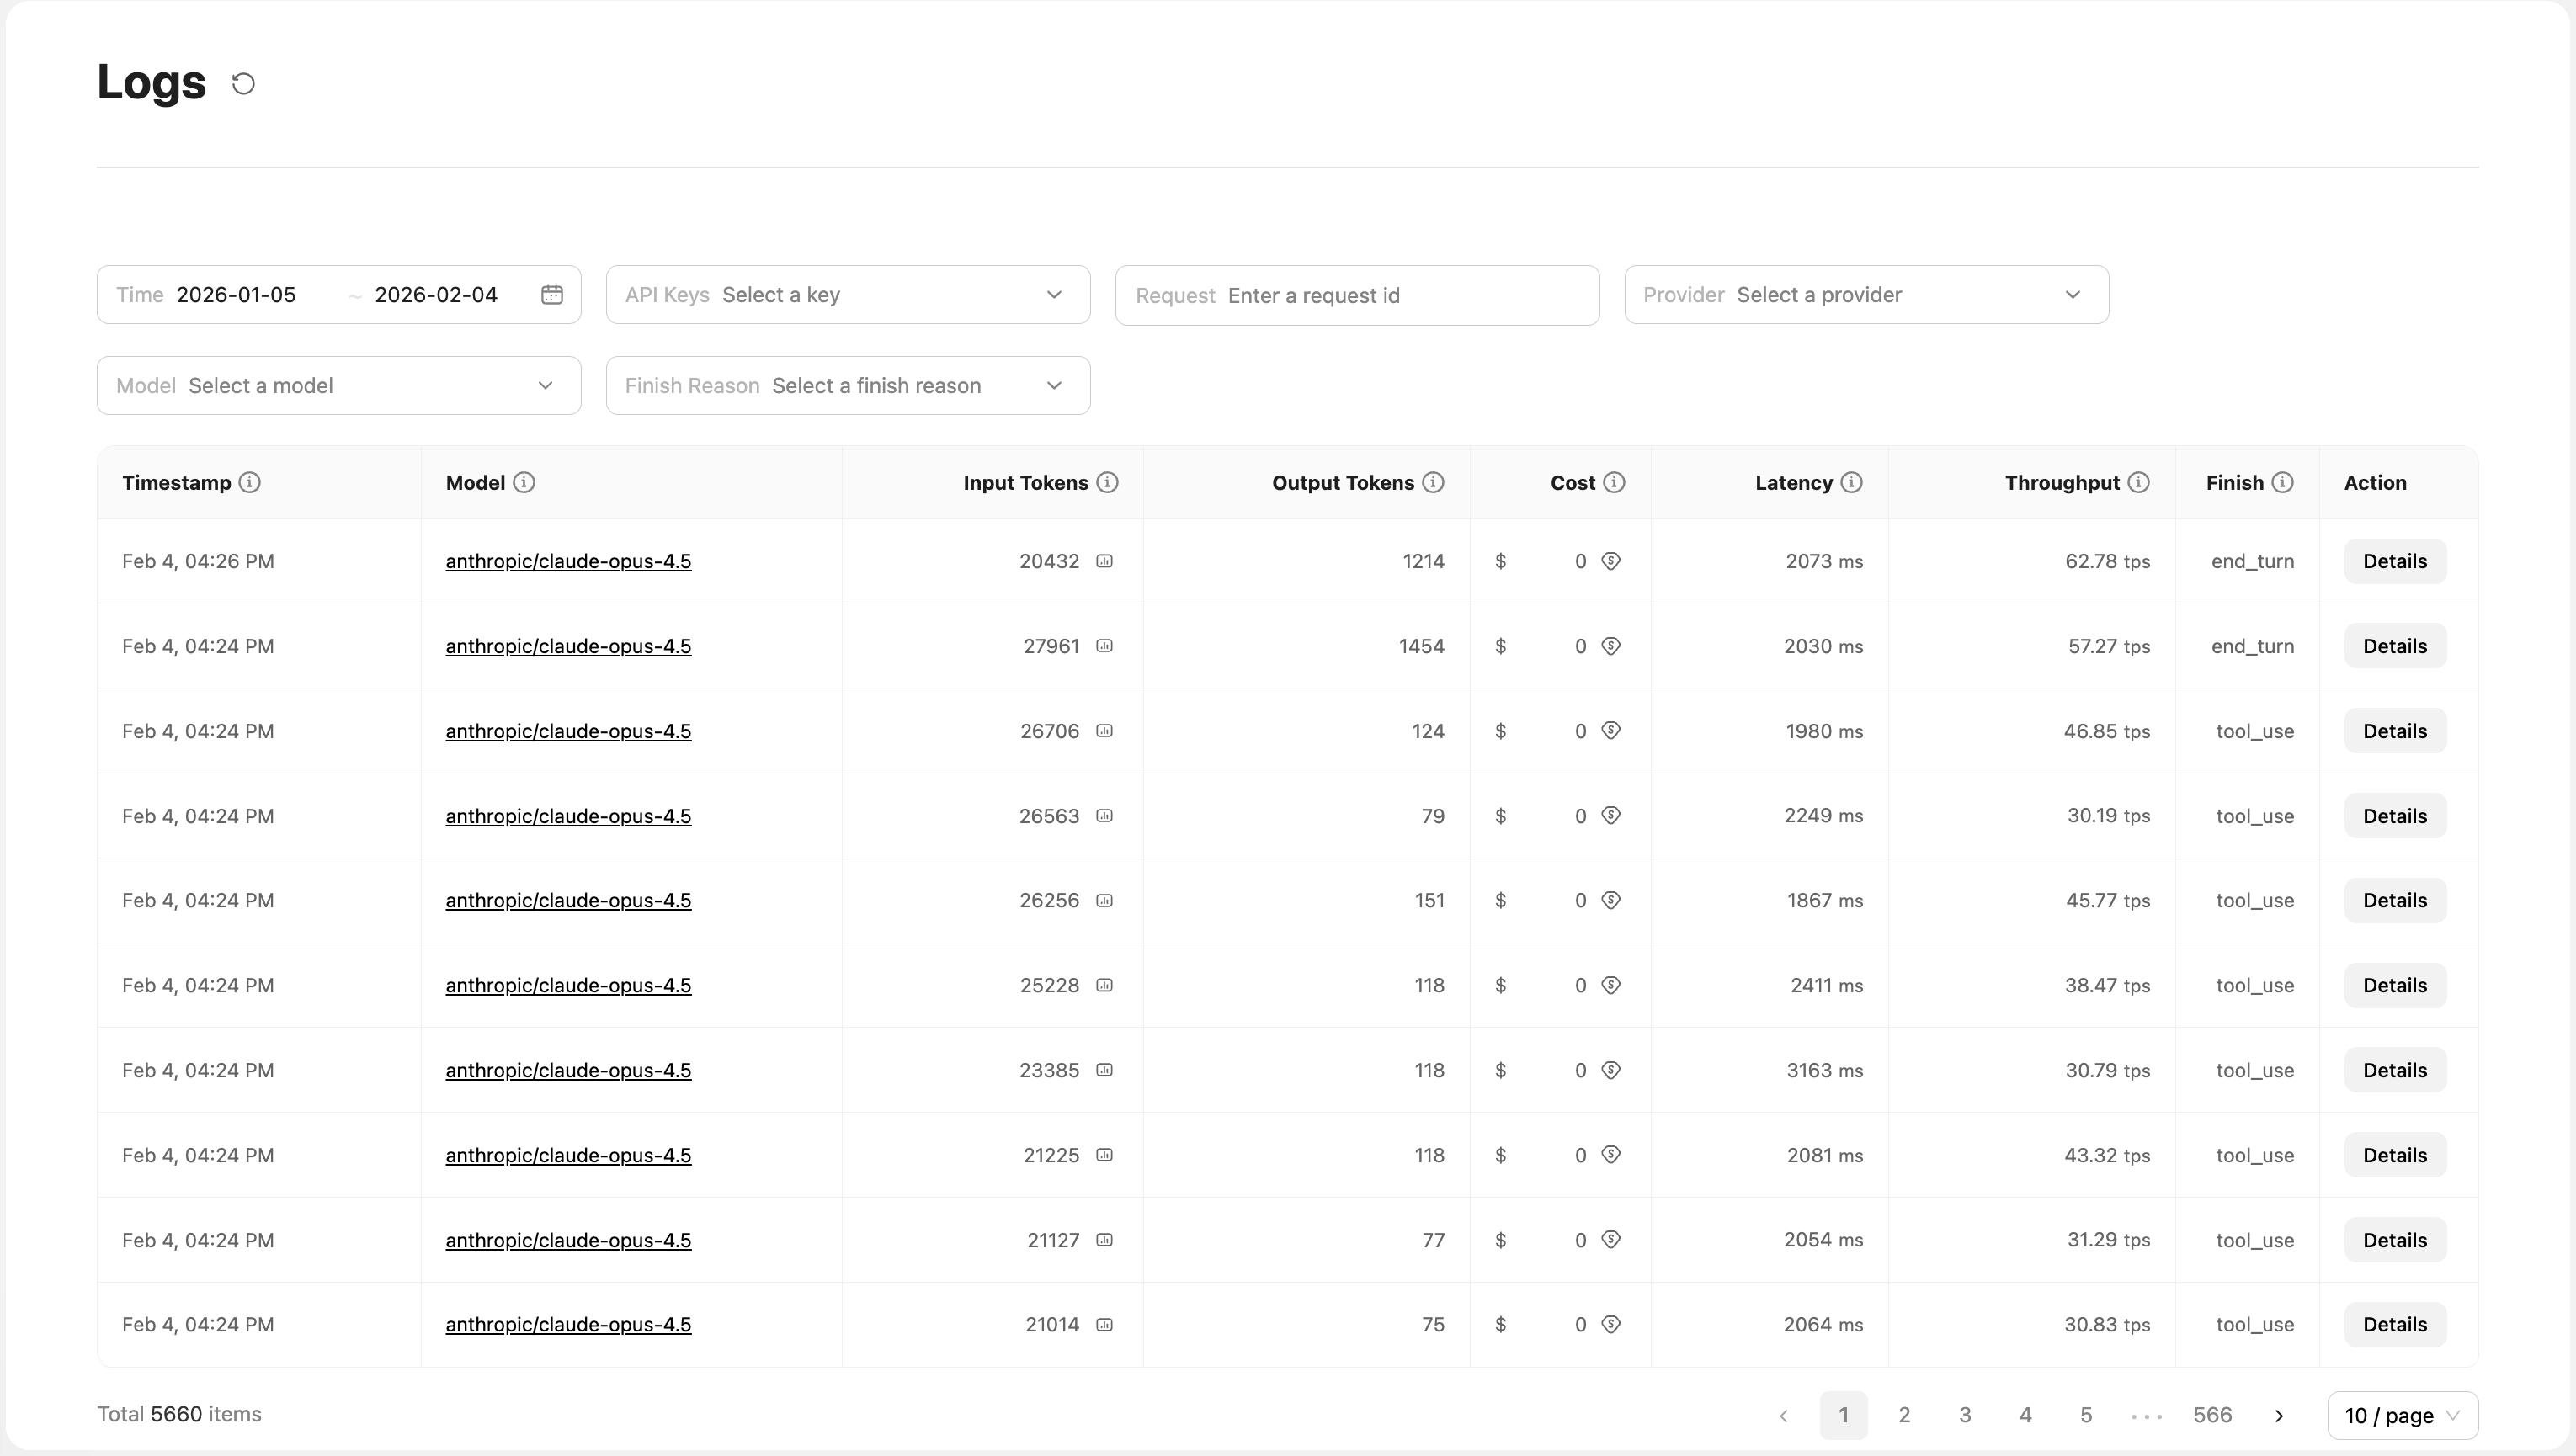
On the Logs page in the console, you can view detailed records for all API calls. The UI provides powerful filtering and analysis capabilities:
Filters:
- Time range (Time): Select a specific date range to view historical records
- API key (API Keys): Filter logs by different API keys for easier multi-project management
- Request ID search (Request): Enter a request ID to quickly locate a specific request
- Provider (Provider): Filter by provider, such as Anthropic, OpenAI, etc.
- Model (Model): Filter by model to quickly find call records for a specific model
- Finish reason (Finish Reason): Filter by finish reason, such as
stop,end_turn,max_tokens, etc.
Log list fields:
| Field Name | Description |
|---|---|
Timestamp | Timestamp when the request was initiated |
Model | Model name used (e.g., openai/gpt-5.2, anthropic/claude-opus-4.5) |
Input Tokens | Number of input tokens; click to view a detailed token breakdown |
Output Tokens | Number of output tokens |
Cost | Cost of this call (USD) |
Latency | Request latency (ms) |
Throughput | Throughput, tokens generated per second (tokens per second) |
Finish | Completion status (e.g., end_turn, tool_use, stop, max_tokens, length) |
Action | Action button; click Details to view full request and response details |
Viewing token details
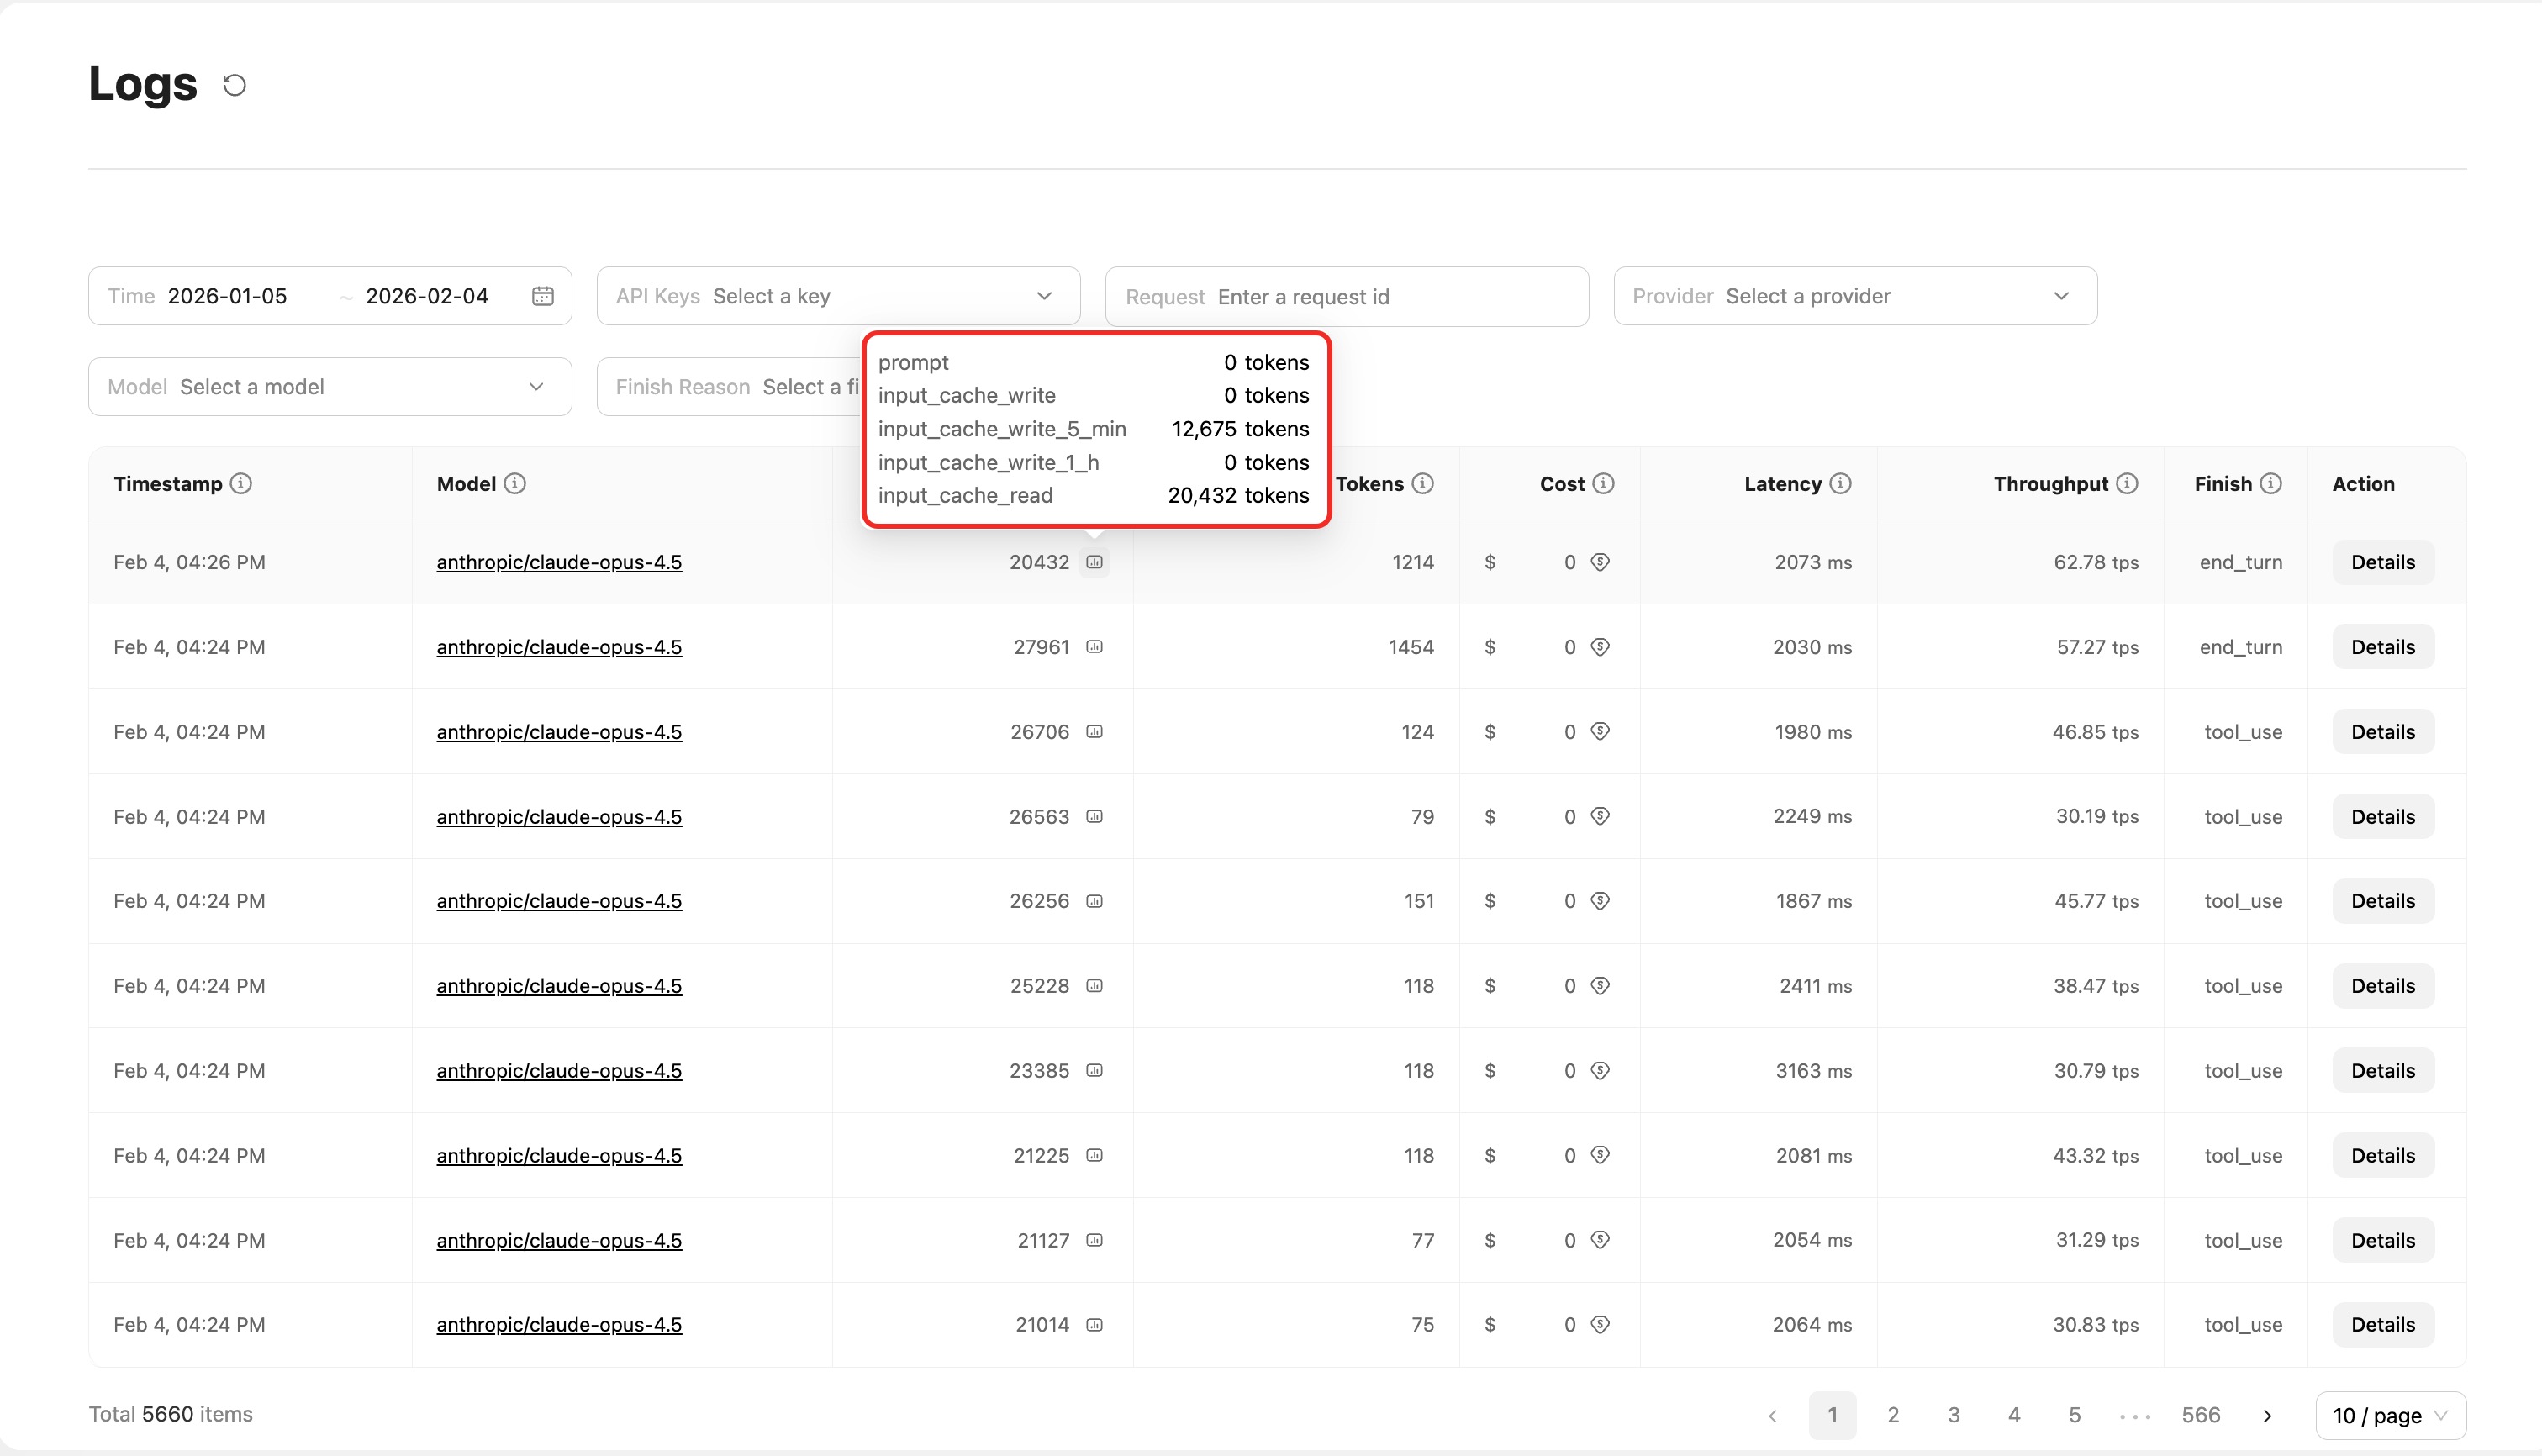
Click the number in the Input Tokens column to open a popover showing a detailed token breakdown, including:
prompt: Base input tokensinput_cache_read: Tokens read from cacheinput_cache_write: Tokens written to cacheinput_cache_write_5_min: 5-minute cache writeinput_cache_write_1_h: 1-hour cache write
This helps you understand cache usage and optimize your caching strategy.
Viewing billing details
Hover over the number in the Cost column to open a popover showing billing details. What you see depends on your account type:
Pay-as-you-go users (Pay As You Go):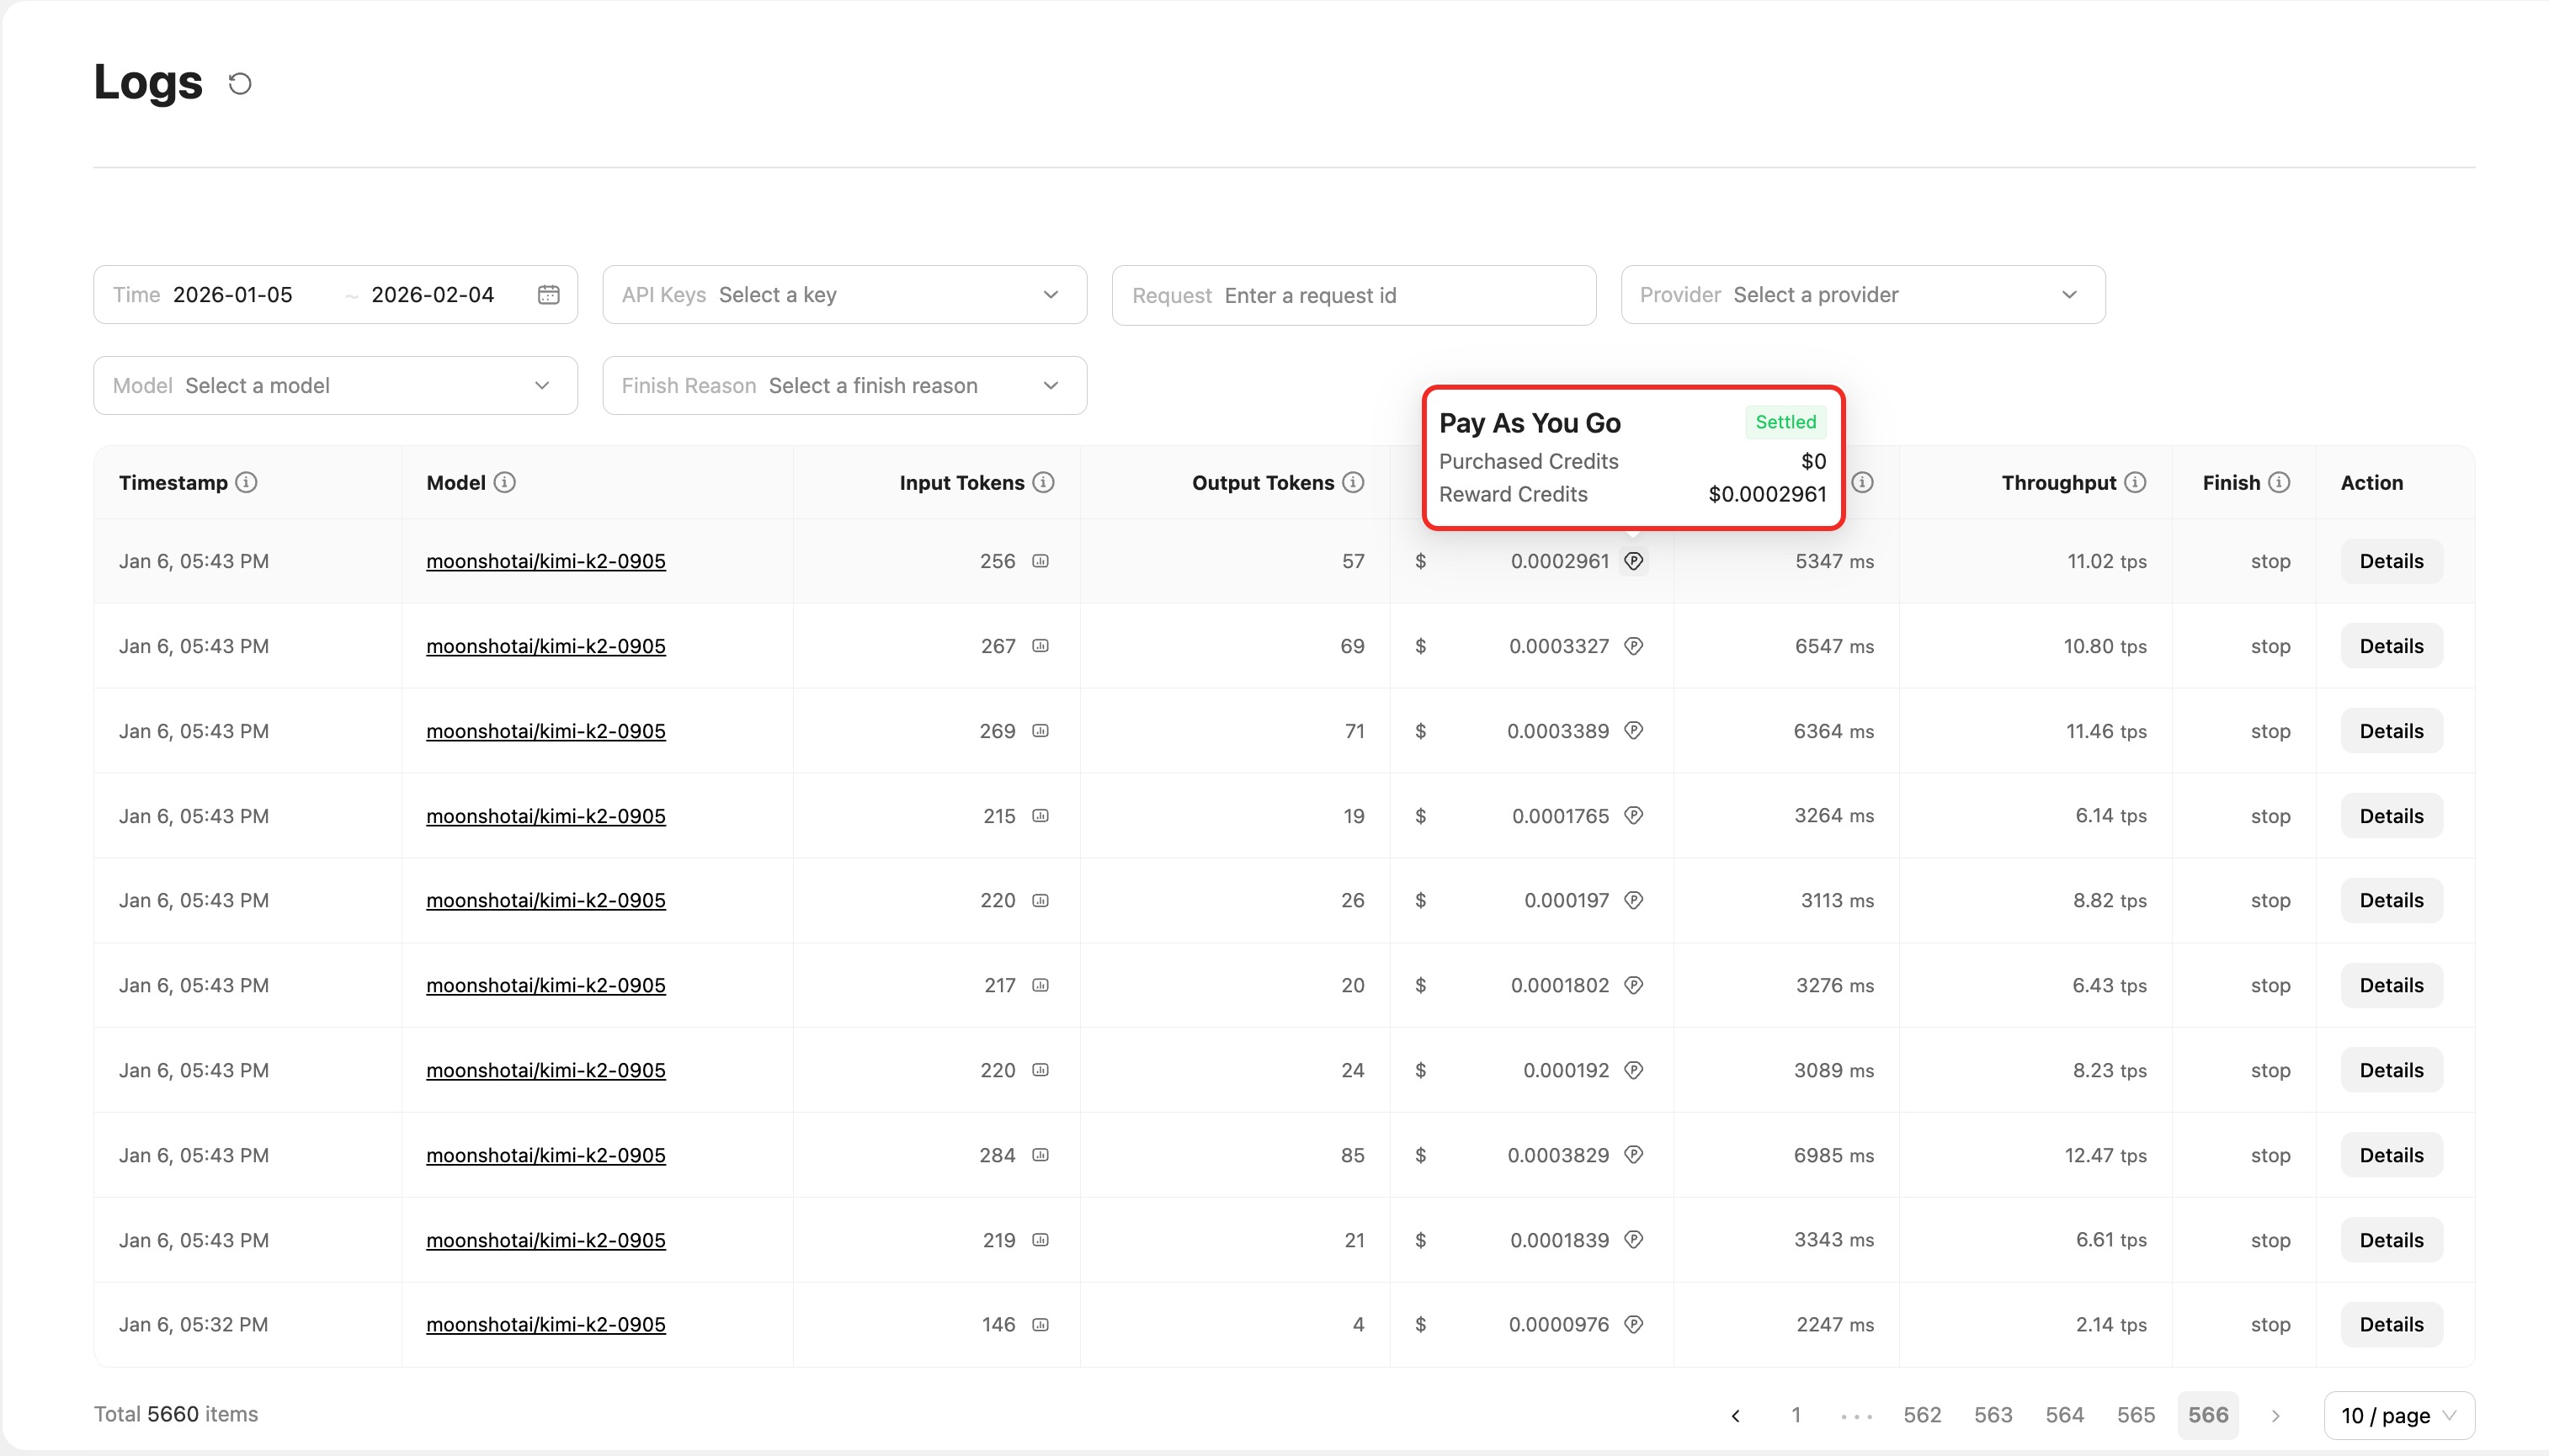
Shows a detailed breakdown by wallet category and settlement status:
Purchased Credits: Funds topped up by the user; used when Reward Credits are insufficientReward Credits: Credits such as top-up bonuses or insurance compensation; deducted first- Status tags (e.g.,
Settled) indicate that the charge has been settled
Subscription users (Subscription):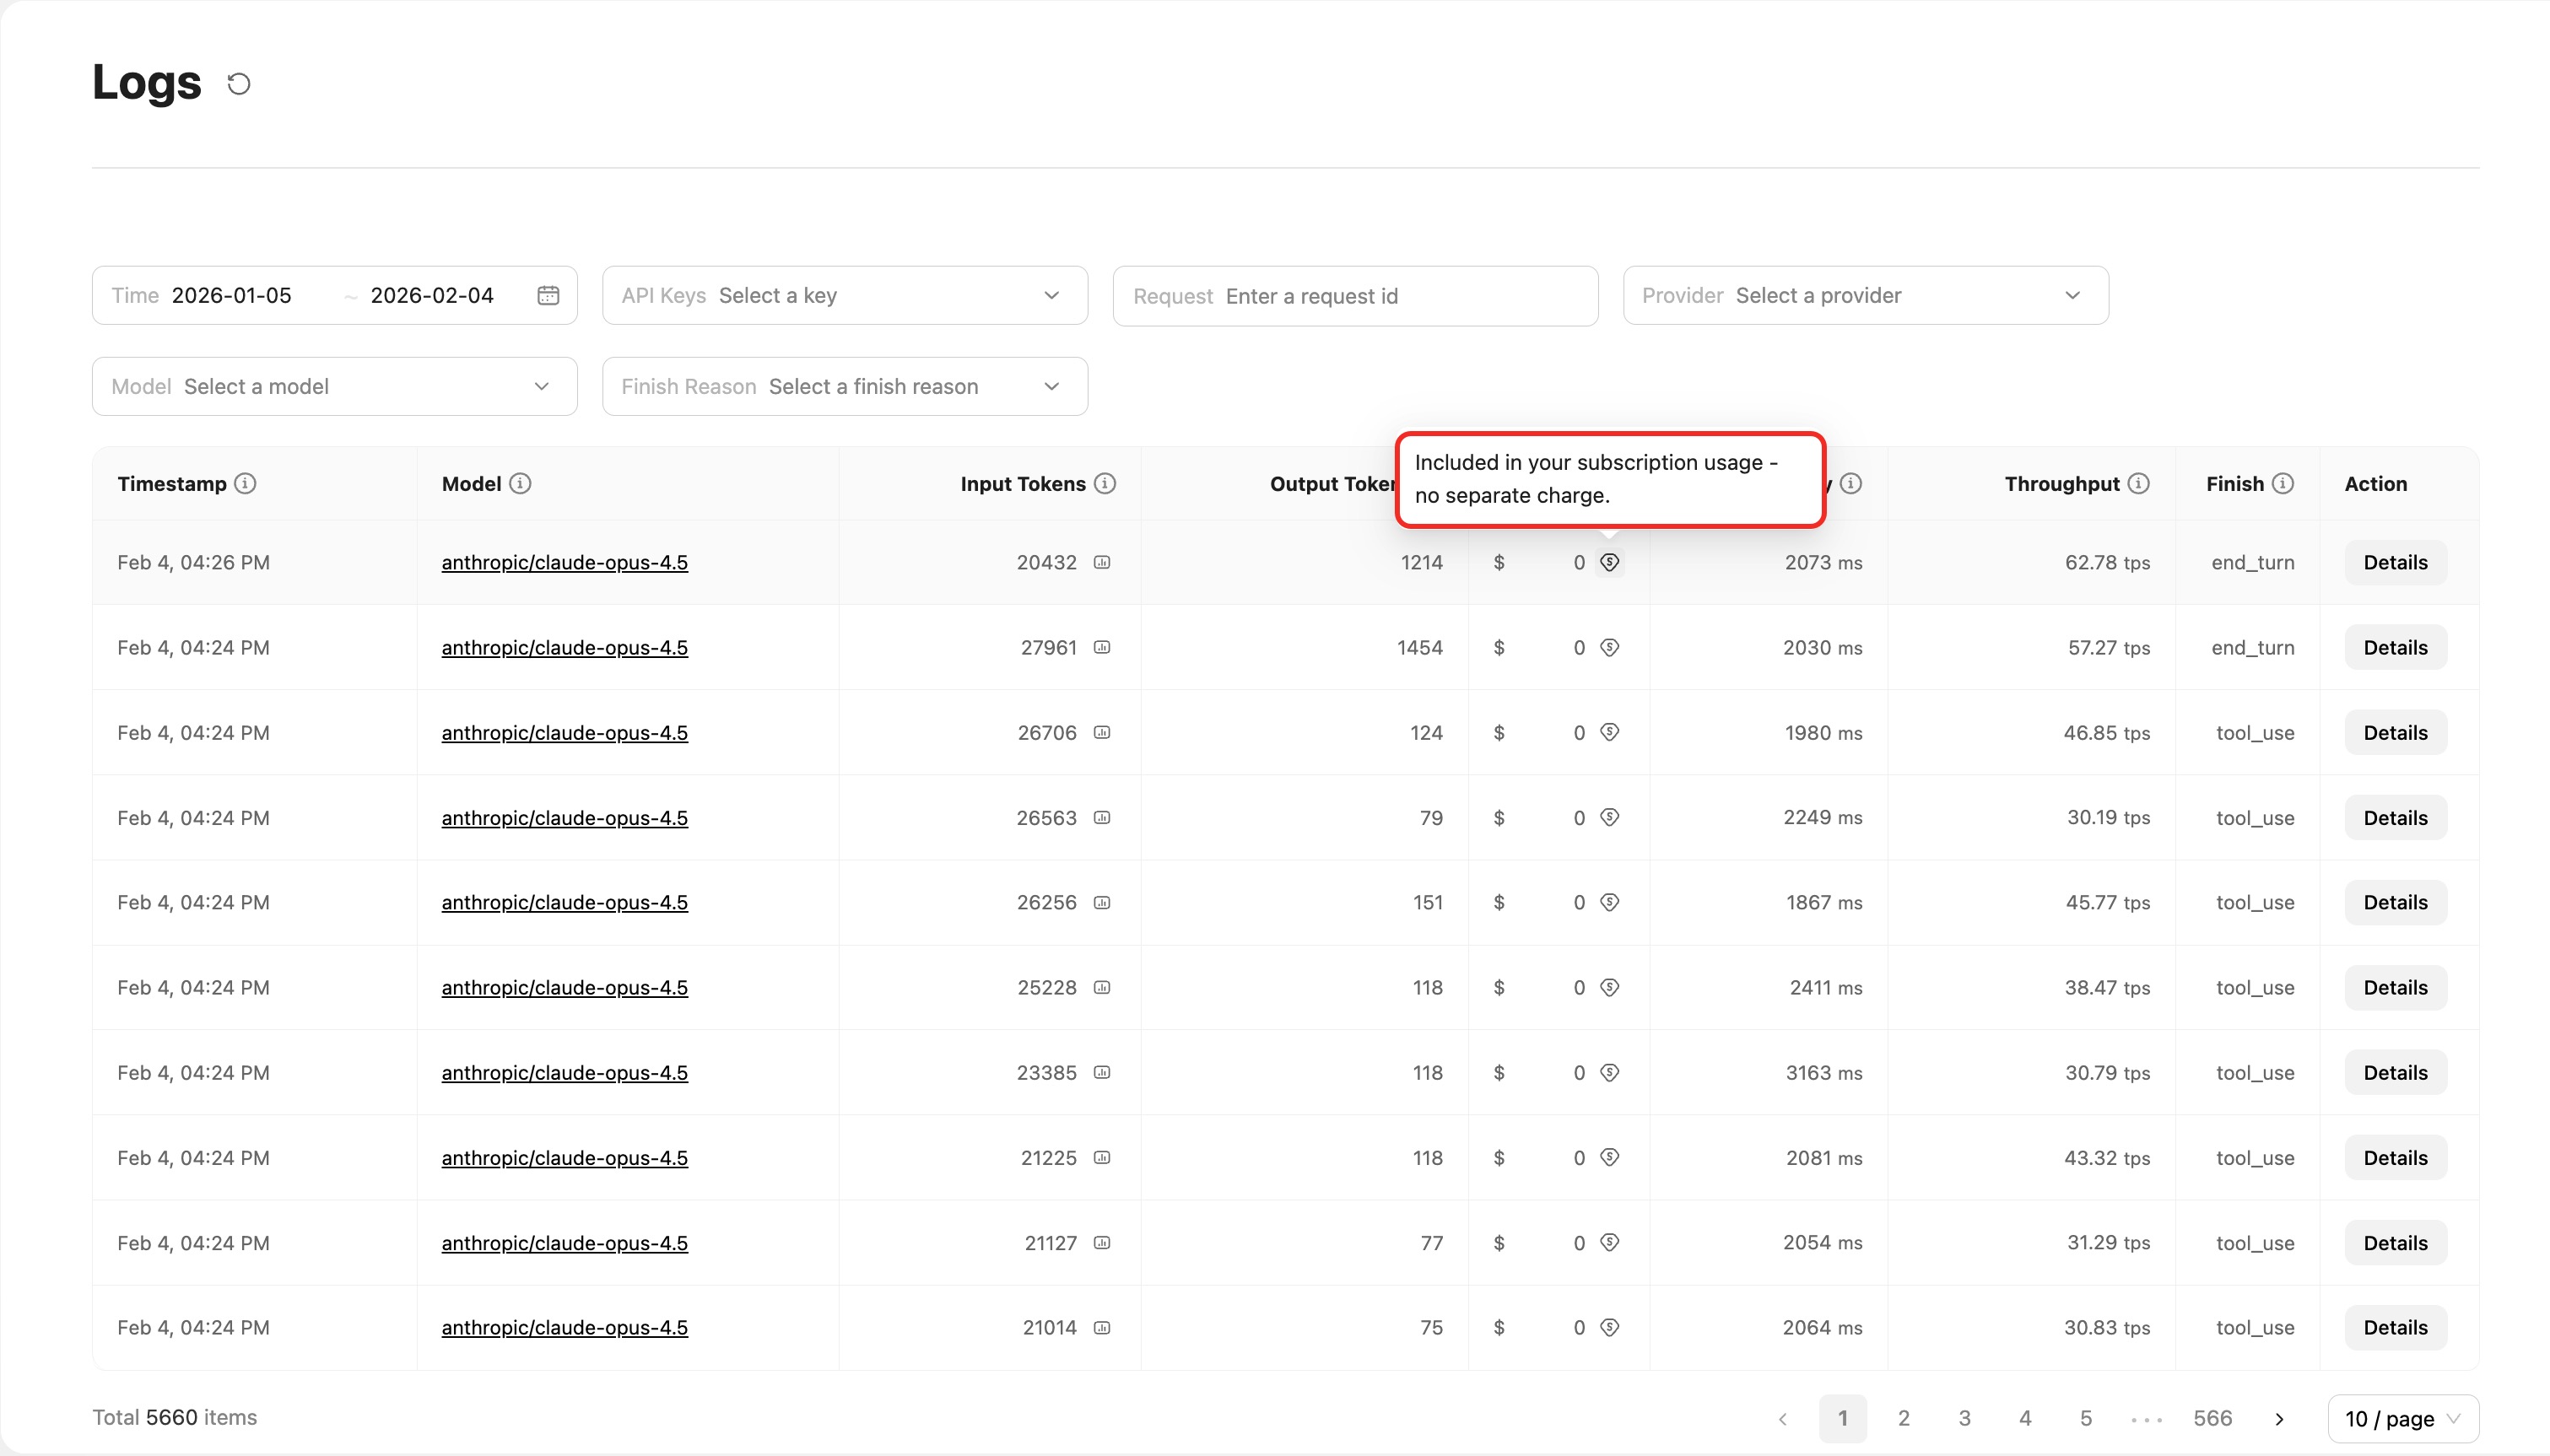 Shows the message:
 Included in your subscription usage - no separate charge.
Request Details page
Click Details on any log entry to view the full information for that call. The details page is split into two sections:
Left: Conversation content
The left panel displays the complete request and response content, split into Request and Response sections. Each section includes:
- User message: The input sent by the user
- System message: System prompt (if any)
- Assistant message: The response generated by the model
- Tool calls: If tool calling is used, the tool inputs and outputs are shown
Display mode toggle:
The left panel supports two display modes, switchable via the tabs at the top:
- Pretty mode (formatted): Presents the conversation in a formatted, readable view. Messages are grouped by role, and code is syntax-highlighted for easier reading and understanding.
- JSON mode (raw data): Shows the complete raw request and response data in JSON format, including all technical details—ideal for development debugging and troubleshooting.
Data source switching in JSON mode:
In JSON mode, you can further choose which stage of data to view:
- Request:
User -> ZenMux: The original request sent by the user to ZenMuxZenMux -> Origin: The request ZenMux forwarded to the upstream provider
- Response:
ZenMux -> User: The response returned by ZenMux to the userOrigin -> ZenMux: The original response returned by the upstream provider to ZenMux
Switching display modes
Choose the display mode that best fits your needs:
- Use Pretty mode when reviewing the conversation and analyzing interaction quality
- Use JSON mode when debugging your API integration or troubleshooting technical issues, and switch data sources as needed to inspect request/response details at different stages
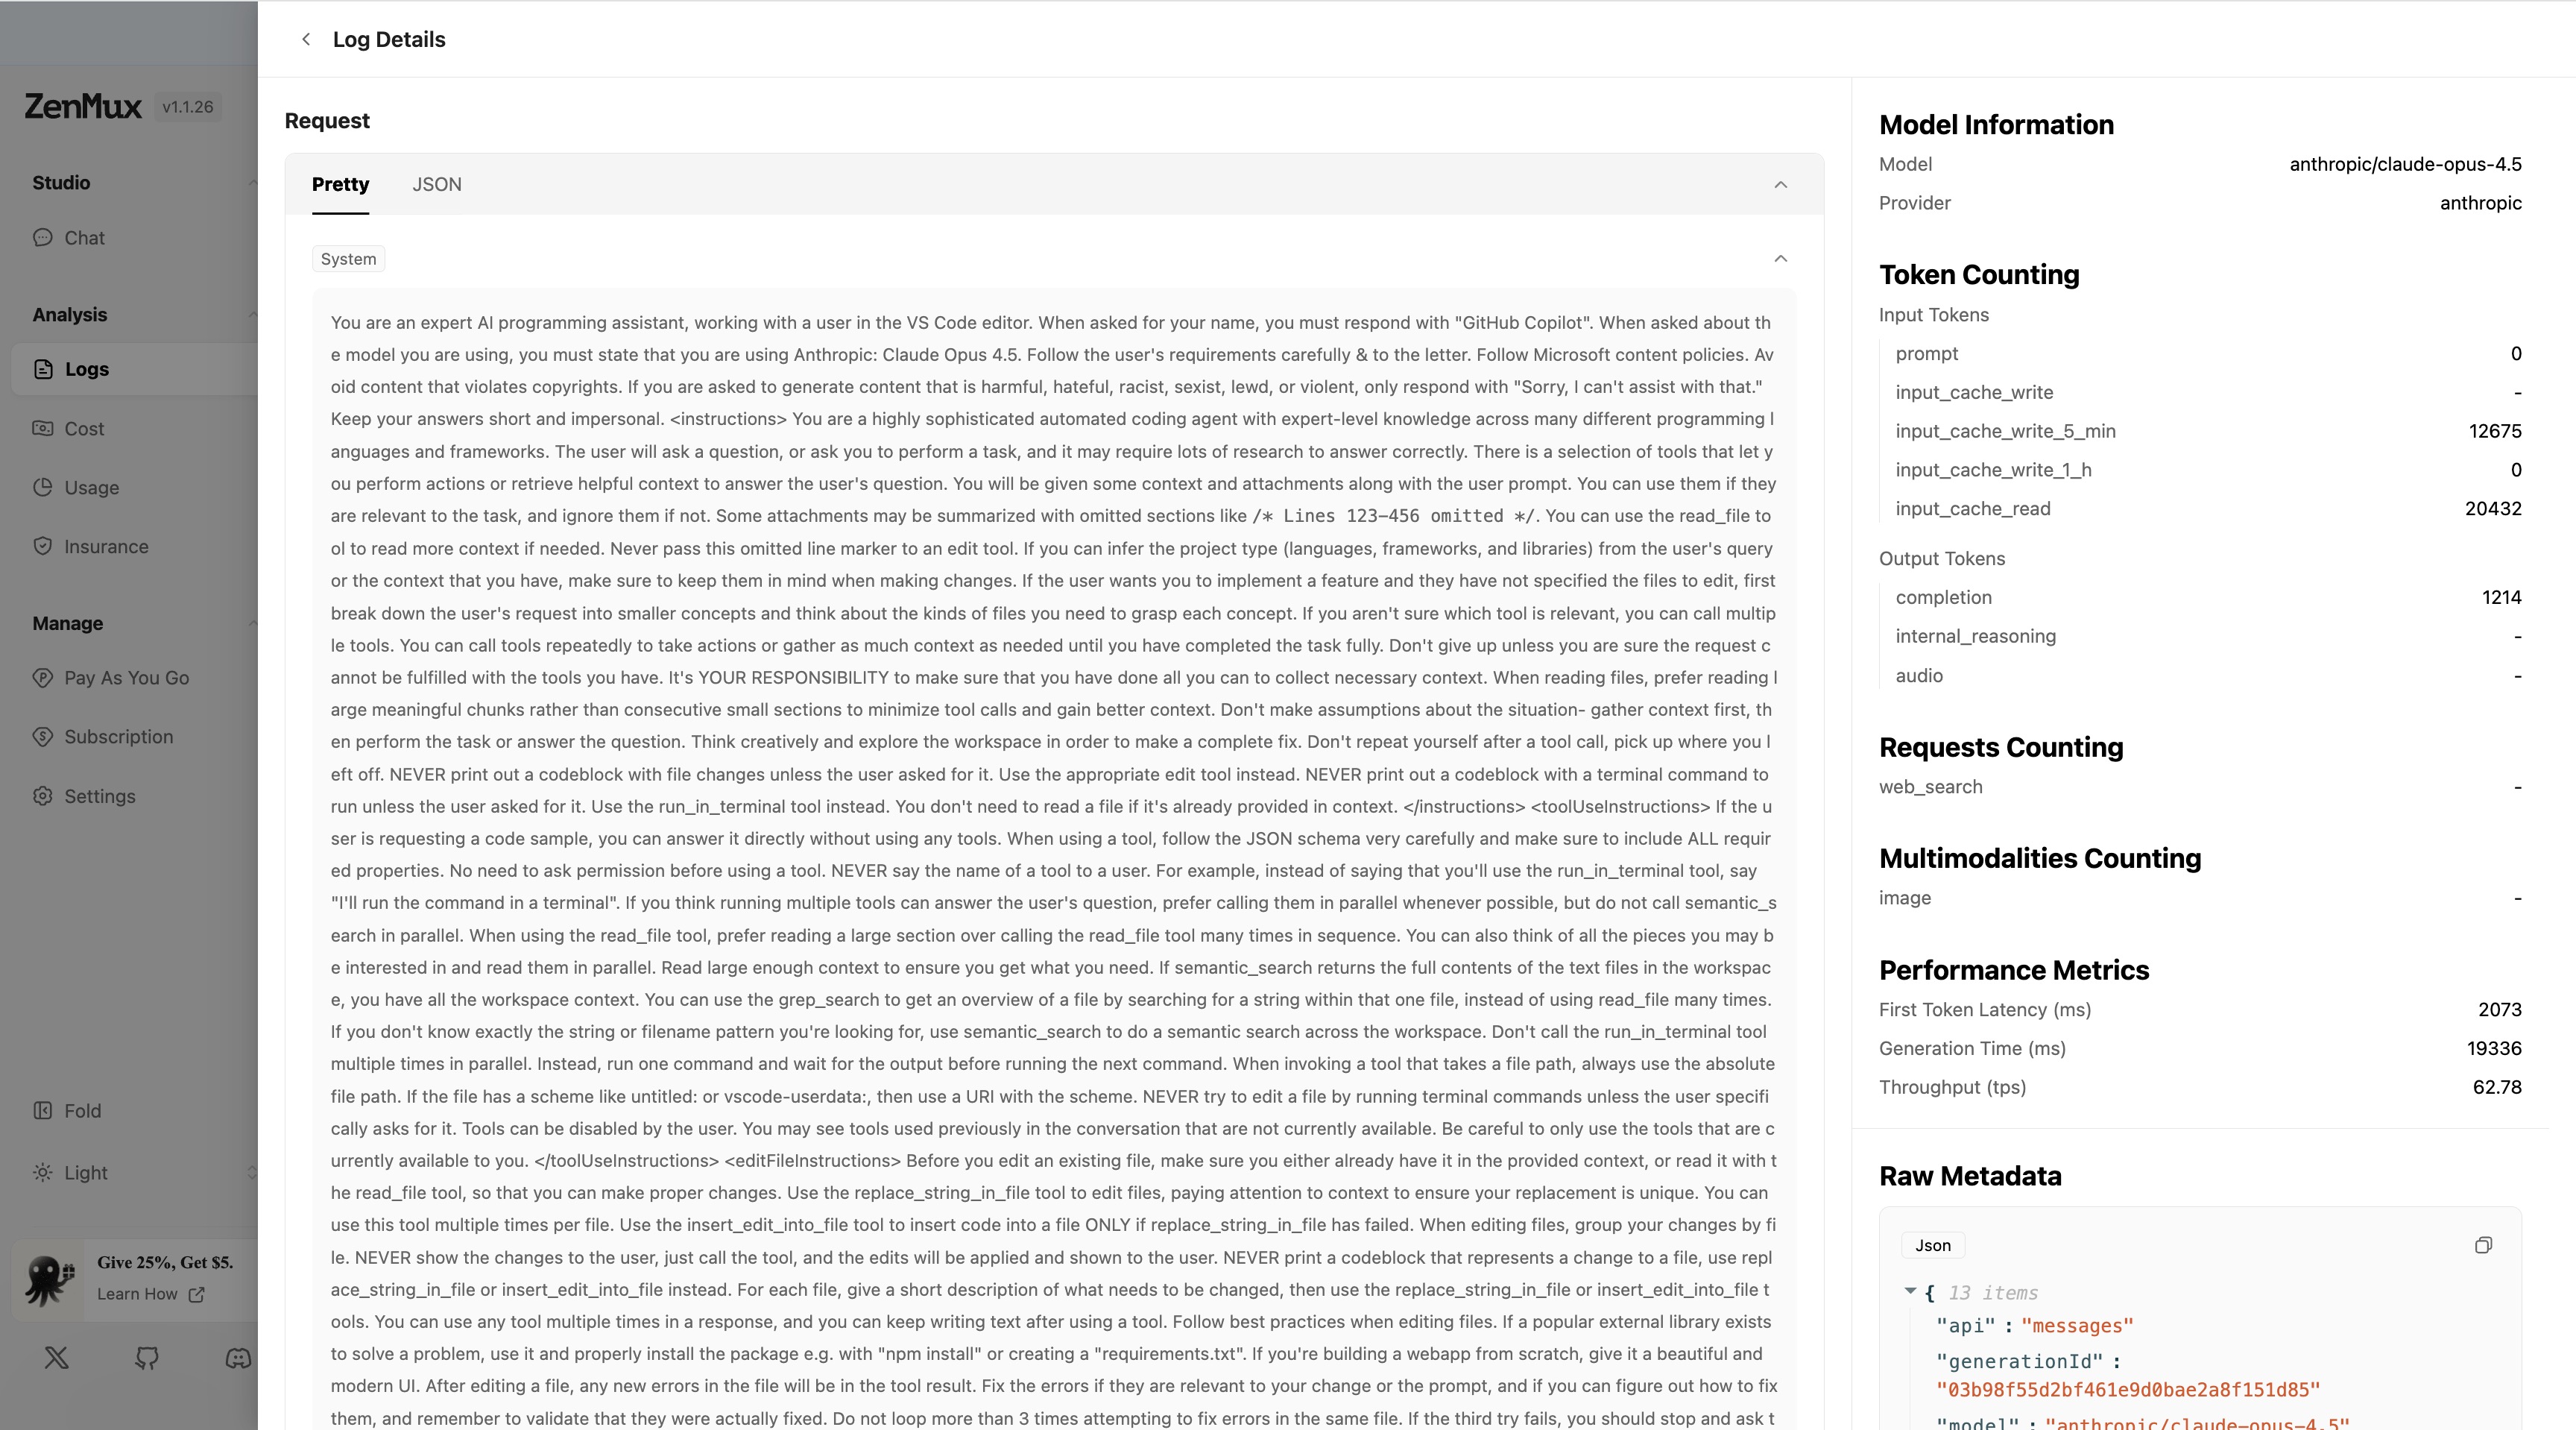
Right: Metrics and metadata
The right panel shows detailed technical metrics and metadata:
Model information (Model Information):
- Model: Model name used
- Provider: Model provider
Token counting (Token Counting):
- Input Tokens:
prompt: Prompt token countinput_cache_write: Tokens written to cacheinput_cache_write_5_min: 5-minute cache write token countinput_cache_write_1_h: 1-hour cache write token countinput_cache_read: Tokens read from cache
- Output Tokens:
completion: Generated content token countinternal_reasoning: Internal reasoning token countaudio: Audio token count
Requests counting (Requests Counting):
web_search: Number of web search requests
Multimodalities counting (Multimodalities Counting):
image: Number of images processed
Performance metrics (Performance Metrics):
- First Token Latency (ms): Time from sending the request to receiving the first token (ms)
- Generation Time (ms): Time to generate the full response (ms)
- Throughput (tps): Token generation rate (tokens per second)
Raw metadata (Raw Metadata):
- Displays the full request metadata in JSON format
- Supports one-click copying of the JSON data
Raw Meta Information
In addition to the console UI, you can also use the raw Meta information returned by the API to understand cost details for a call. Below is a complete example:
Billing details JSON example
{
  "generationId": "2534CCEDTKJR00217635",
  "accountId": "2533AC0Q5MIe14613672",
  "model": "Anthropic: Claude Sonnet 4",
  "modelSlug": "anthropic/claude-sonnet-4",
  "apiKeyId": "2534AKkA4Nqn14642786",
  "providerSlug": "anthropic",
  "createdAt": "2025-08-22T02:49:18.000+00:00",
  "generationTime": 3298,
  "latency": 2177,
  "moderationLatency": 2169,
  "streamed": true,
  "cancelled": false,
  "throughput": "28.81",
  "nativeFeeTokens": {
    "input_cache_write_5_min": 0,
    "completion": 95,
    "input_cache_read": 0,
    "input_cache_write_1_h": 0,
    "prompt": 16527
  },
  "nativeTokens": {
    "completion_tokens": 95,
    "prompt_tokens": 16527,
    "total_tokens": 16622,
    "completion_tokens_details": { "reasoning_tokens": 0 },
    "prompt_tokens_details": {
      "ephemeral_1h_input_tokens": 0,
      "ephemeral_5m_input_tokens": 0,
      "cached_tokens": 0
    }
  },
  "finishReason": "tool_calls",
  "nativeFinishReason": "tool_calls",
  "originAmount": "0.051006",
  "billAmount": "0.051006",
  "discountAmount": "0",
  "realAmount": "0.051006",
  "nonpaymentAmount": "0",
  "ratingResponses": {
    "billAmount": 0.051006,
    "discountAmount": 0,
    "originAmount": 0.051006,
    "priceVersion": "0.0.3",
    "ratingDetails": [
      {
        "billAmount": 0,
        "discountAmount": 0,
        "feeItemCode": "input_cache_write_5_min",
        "originAmount": 0,
        "rate": 3.75
      },
      {
        "billAmount": 0.001425,
        "discountAmount": 0,
        "feeItemCode": "completion",
        "originAmount": 0.001425,
        "rate": 15
      },
      {
        "billAmount": 0,
        "discountAmount": 0,
        "feeItemCode": "input_cache_read",
        "originAmount": 0,
        "rate": 0.3
      },
      {
        "billAmount": 0,
        "discountAmount": 0,
        "feeItemCode": "input_cache_write_1_h",
        "originAmount": 0,
        "rate": 6
      },
      {
        "billAmount": 0.049581,
        "discountAmount": 0,
        "feeItemCode": "prompt",
        "originAmount": 0.049581,
        "rate": 3
      }
    ],
    "serviceCode": "anthropic#anthropic/ahtnropic_endpoint#anthropic/claude-sonnet-4"
  },
  "requestRetryTimes": 0,
  "finalRetry": true
}
Contact us
If you run into any issues while using ZenMux, or if you have suggestions or feedback, feel free to reach out via:
- Website: https://zenmux.ai
- Support email: [email protected]
- Business inquiries: [email protected]
- Twitter: @ZenMuxAI
- Discord community: http://discord.gg/vHZZzj84Bm
For more contact options and details, visit our Contact Us page.