Usage Analytics
ZenMux provides comprehensive usage analytics capabilities to help you monitor and analyze API calls, service provider performance, and model efficiency in real-time. Through usage analytics, you can gain deep insights into key metrics such as token consumption, API request volume, and response times, enabling you to optimize application performance and control costs.
Note: The data displayed on this page excludes usage from subscription plans and only tracks Pay As You Go usage.
Usage Overview
In the "Usage" tab, you can view overall resource consumption, including token usage and API request counts.
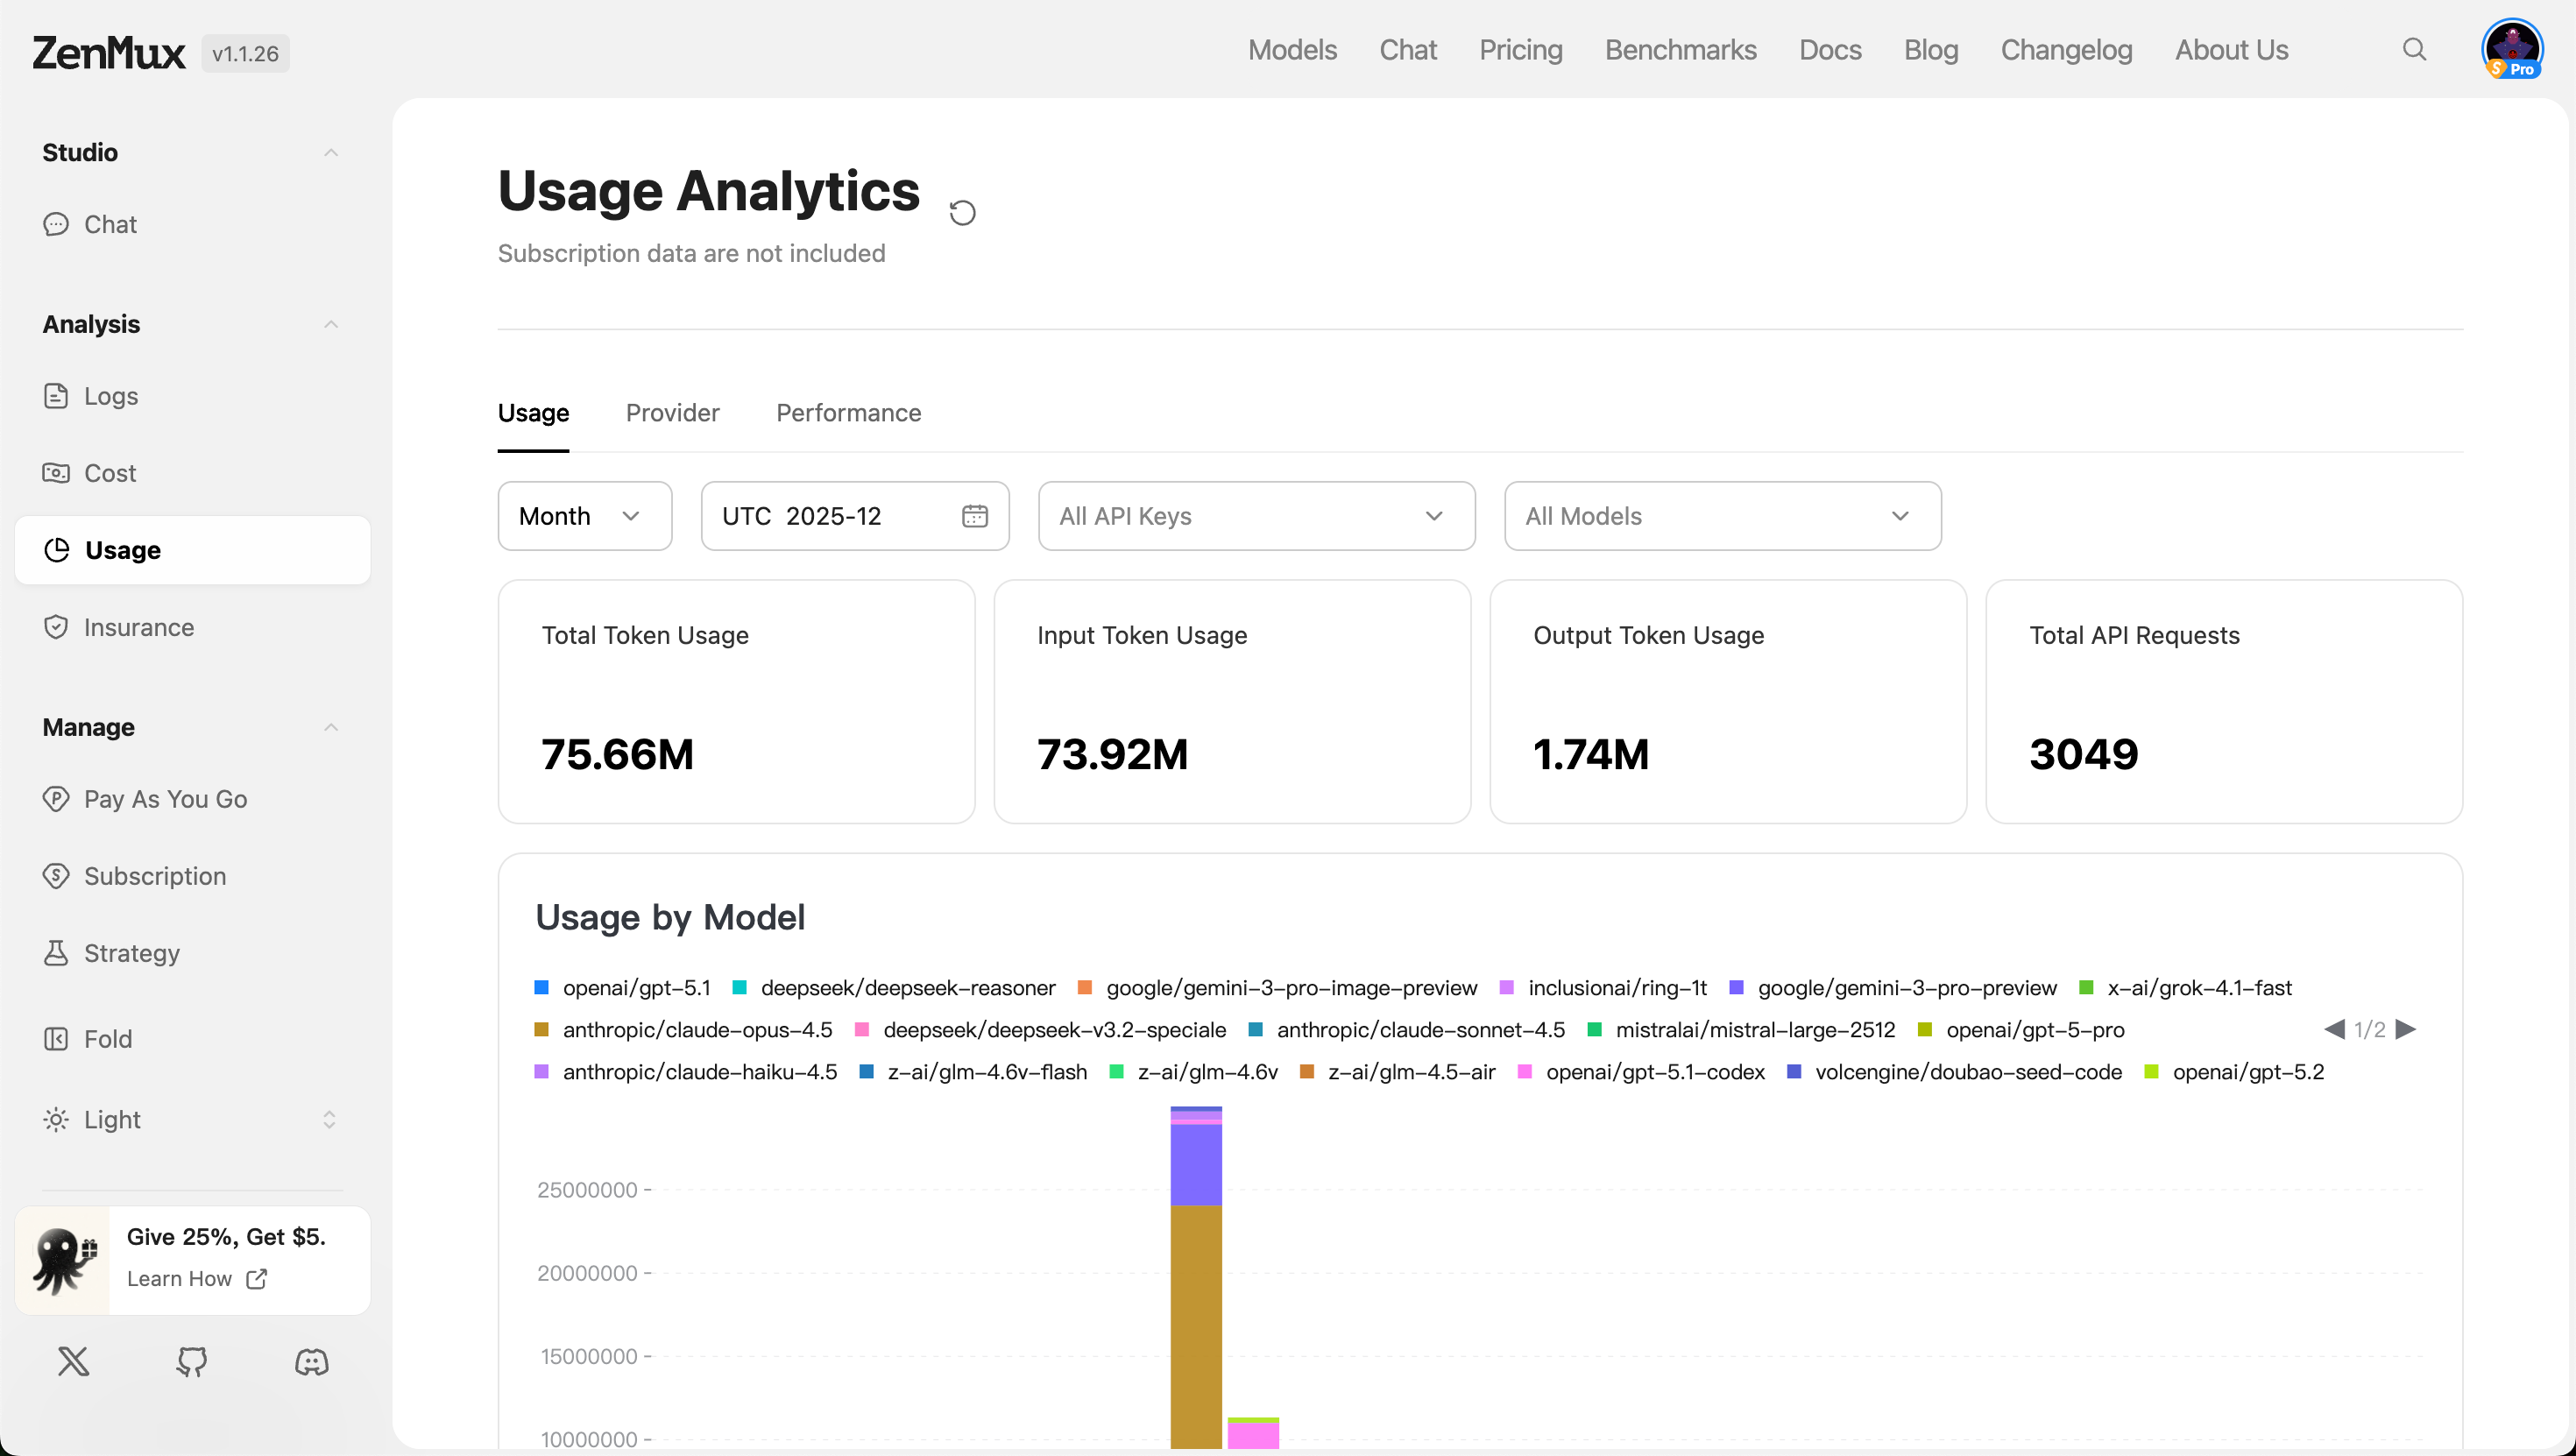
Filter Options:
- Time Range: Filter data by granularity such as "Month", "Week", or "Day".
- API Keys: Filter data by specific API keys, supporting "All Keys" or individual keys.
- Model Scope: Select "All Models" or specify particular model types for analysis.
Metric Descriptions
| Metric | Description |
|---|---|
| Total Token Usage | Total token usage across all models (input + output). |
| Input Token Usage | Total number of input tokens across all requests. |
| Output Token Usage | Total number of output tokens across all responses. |
| Total API Requests | Total number of API calls within the specified time period. |
Analysis by Dimension
- Usage by Model
Displays token usage distribution across different models in charts or tables, helping identify high-consumption models.
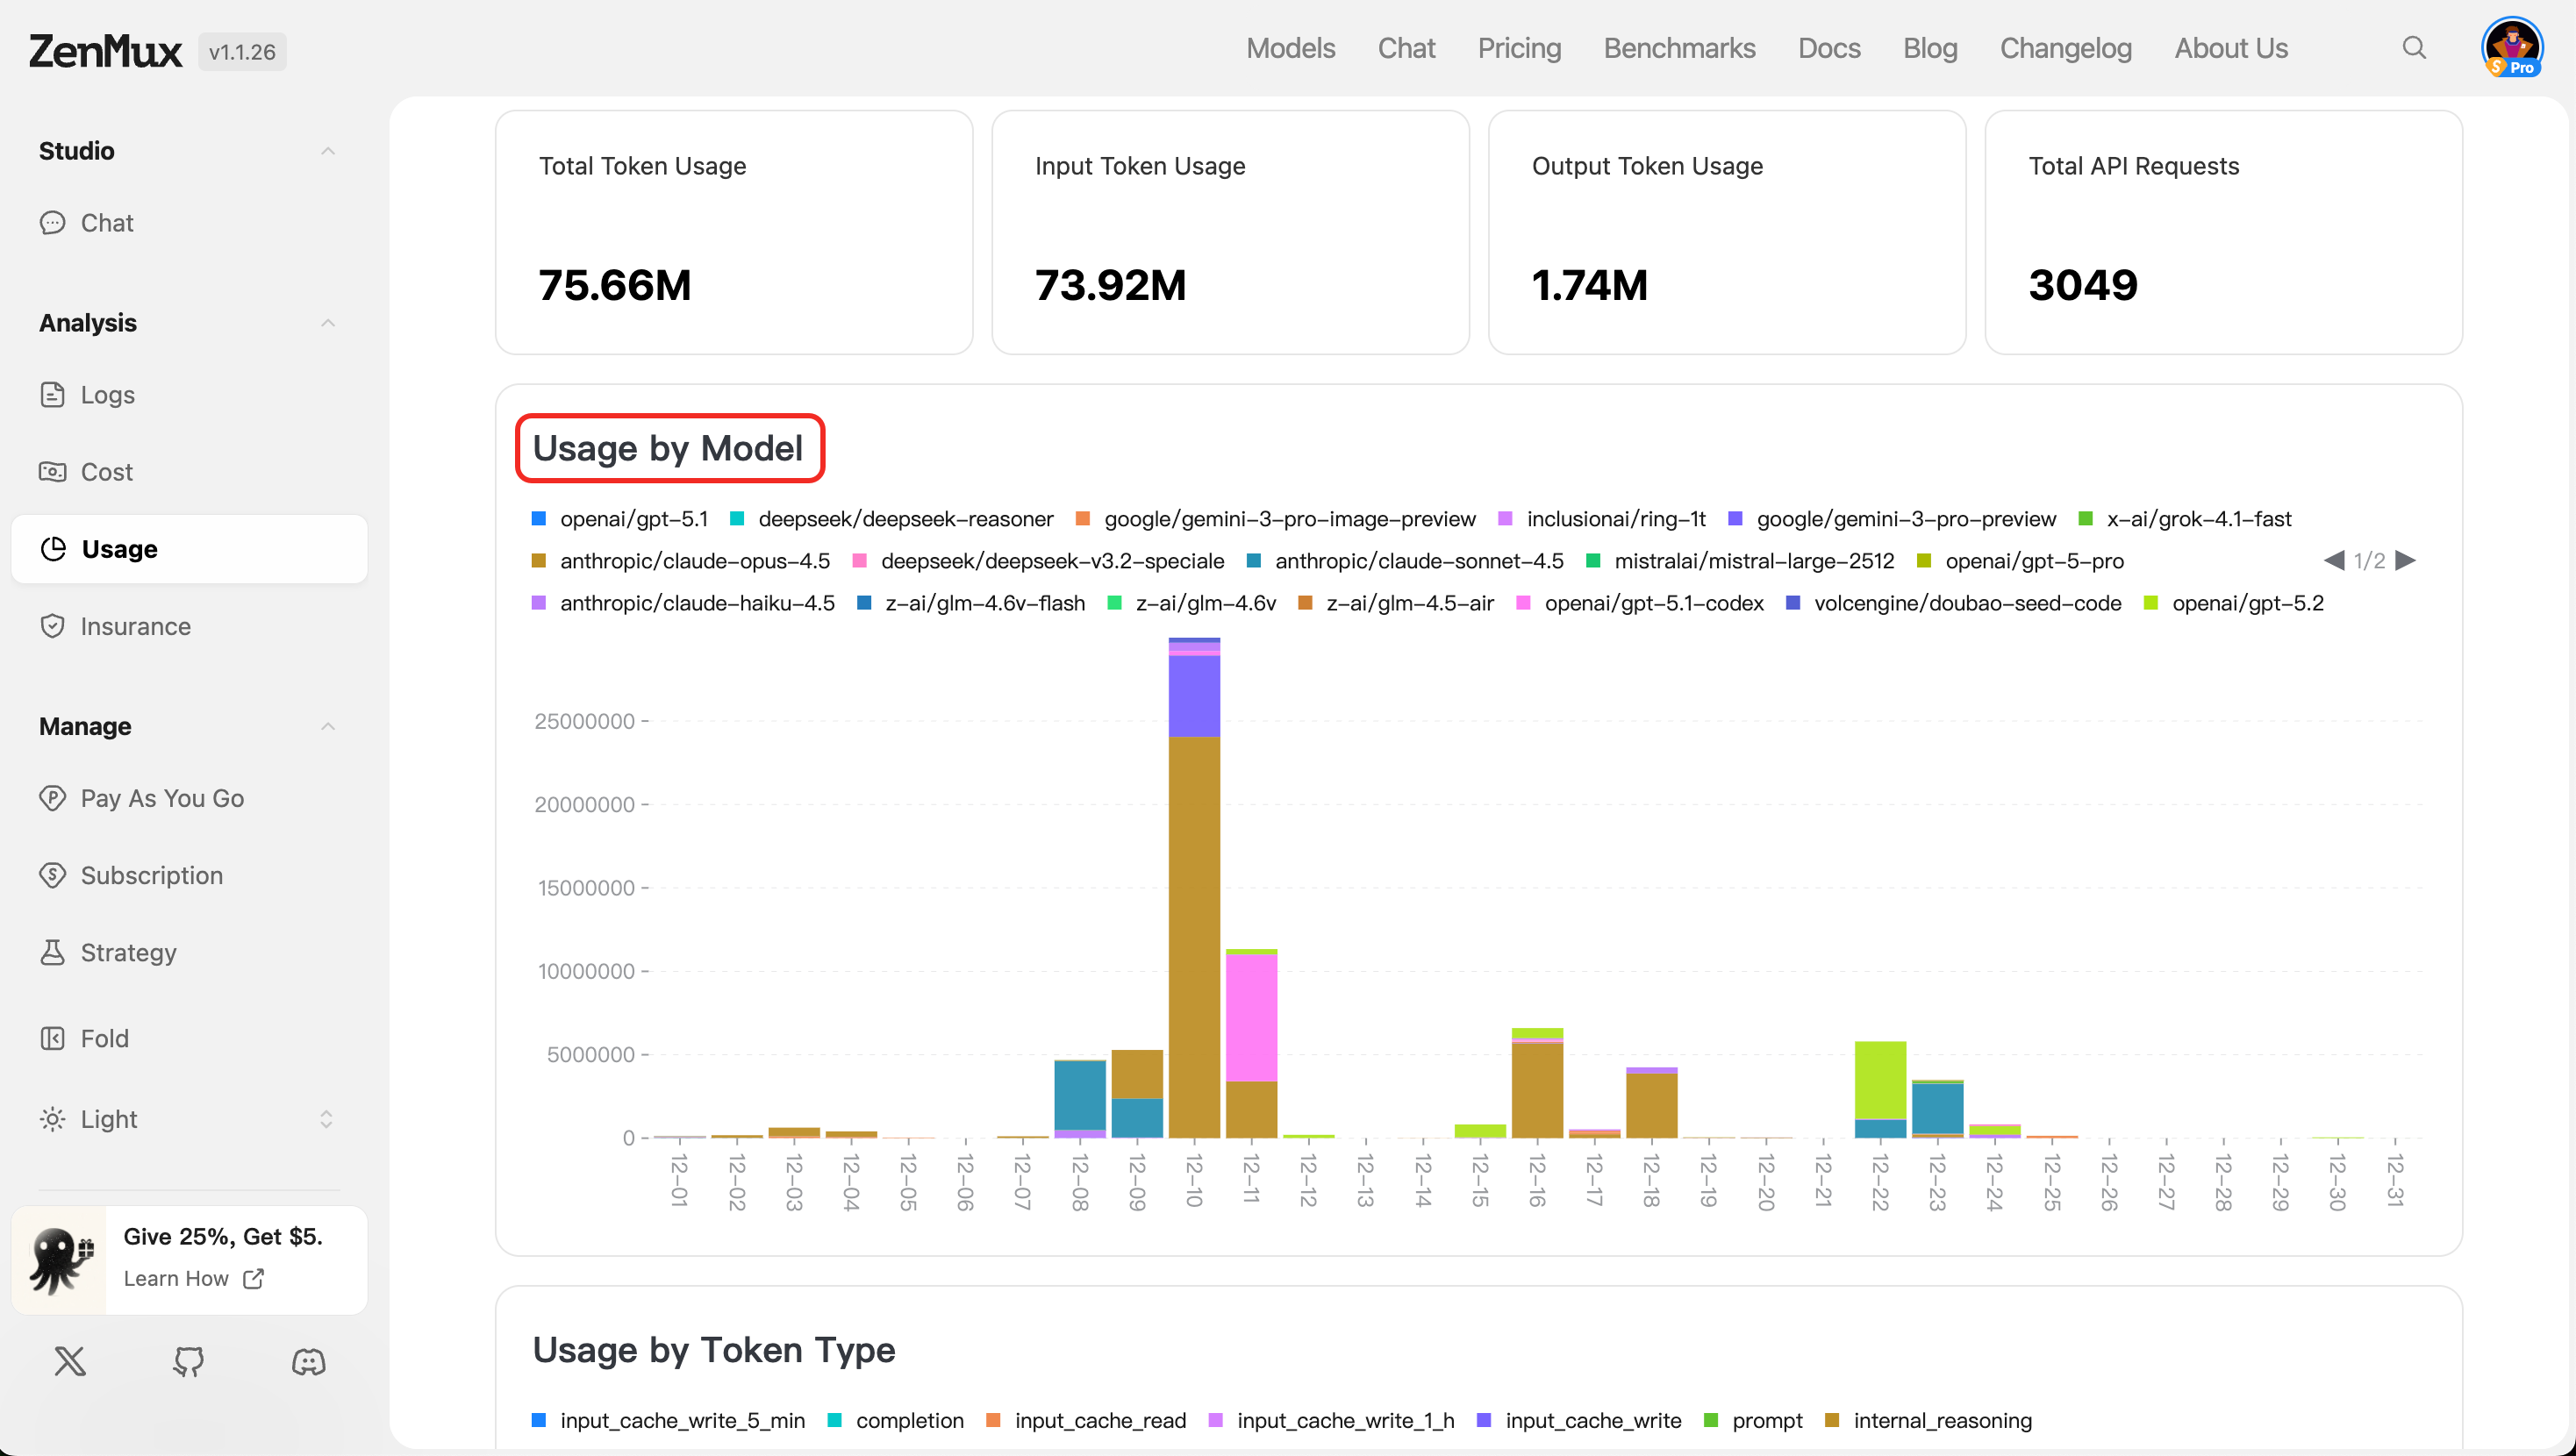
- Usage by Token Type
Separately tracks input and output token usage, making it easier to evaluate the cost structure of requests and responses.
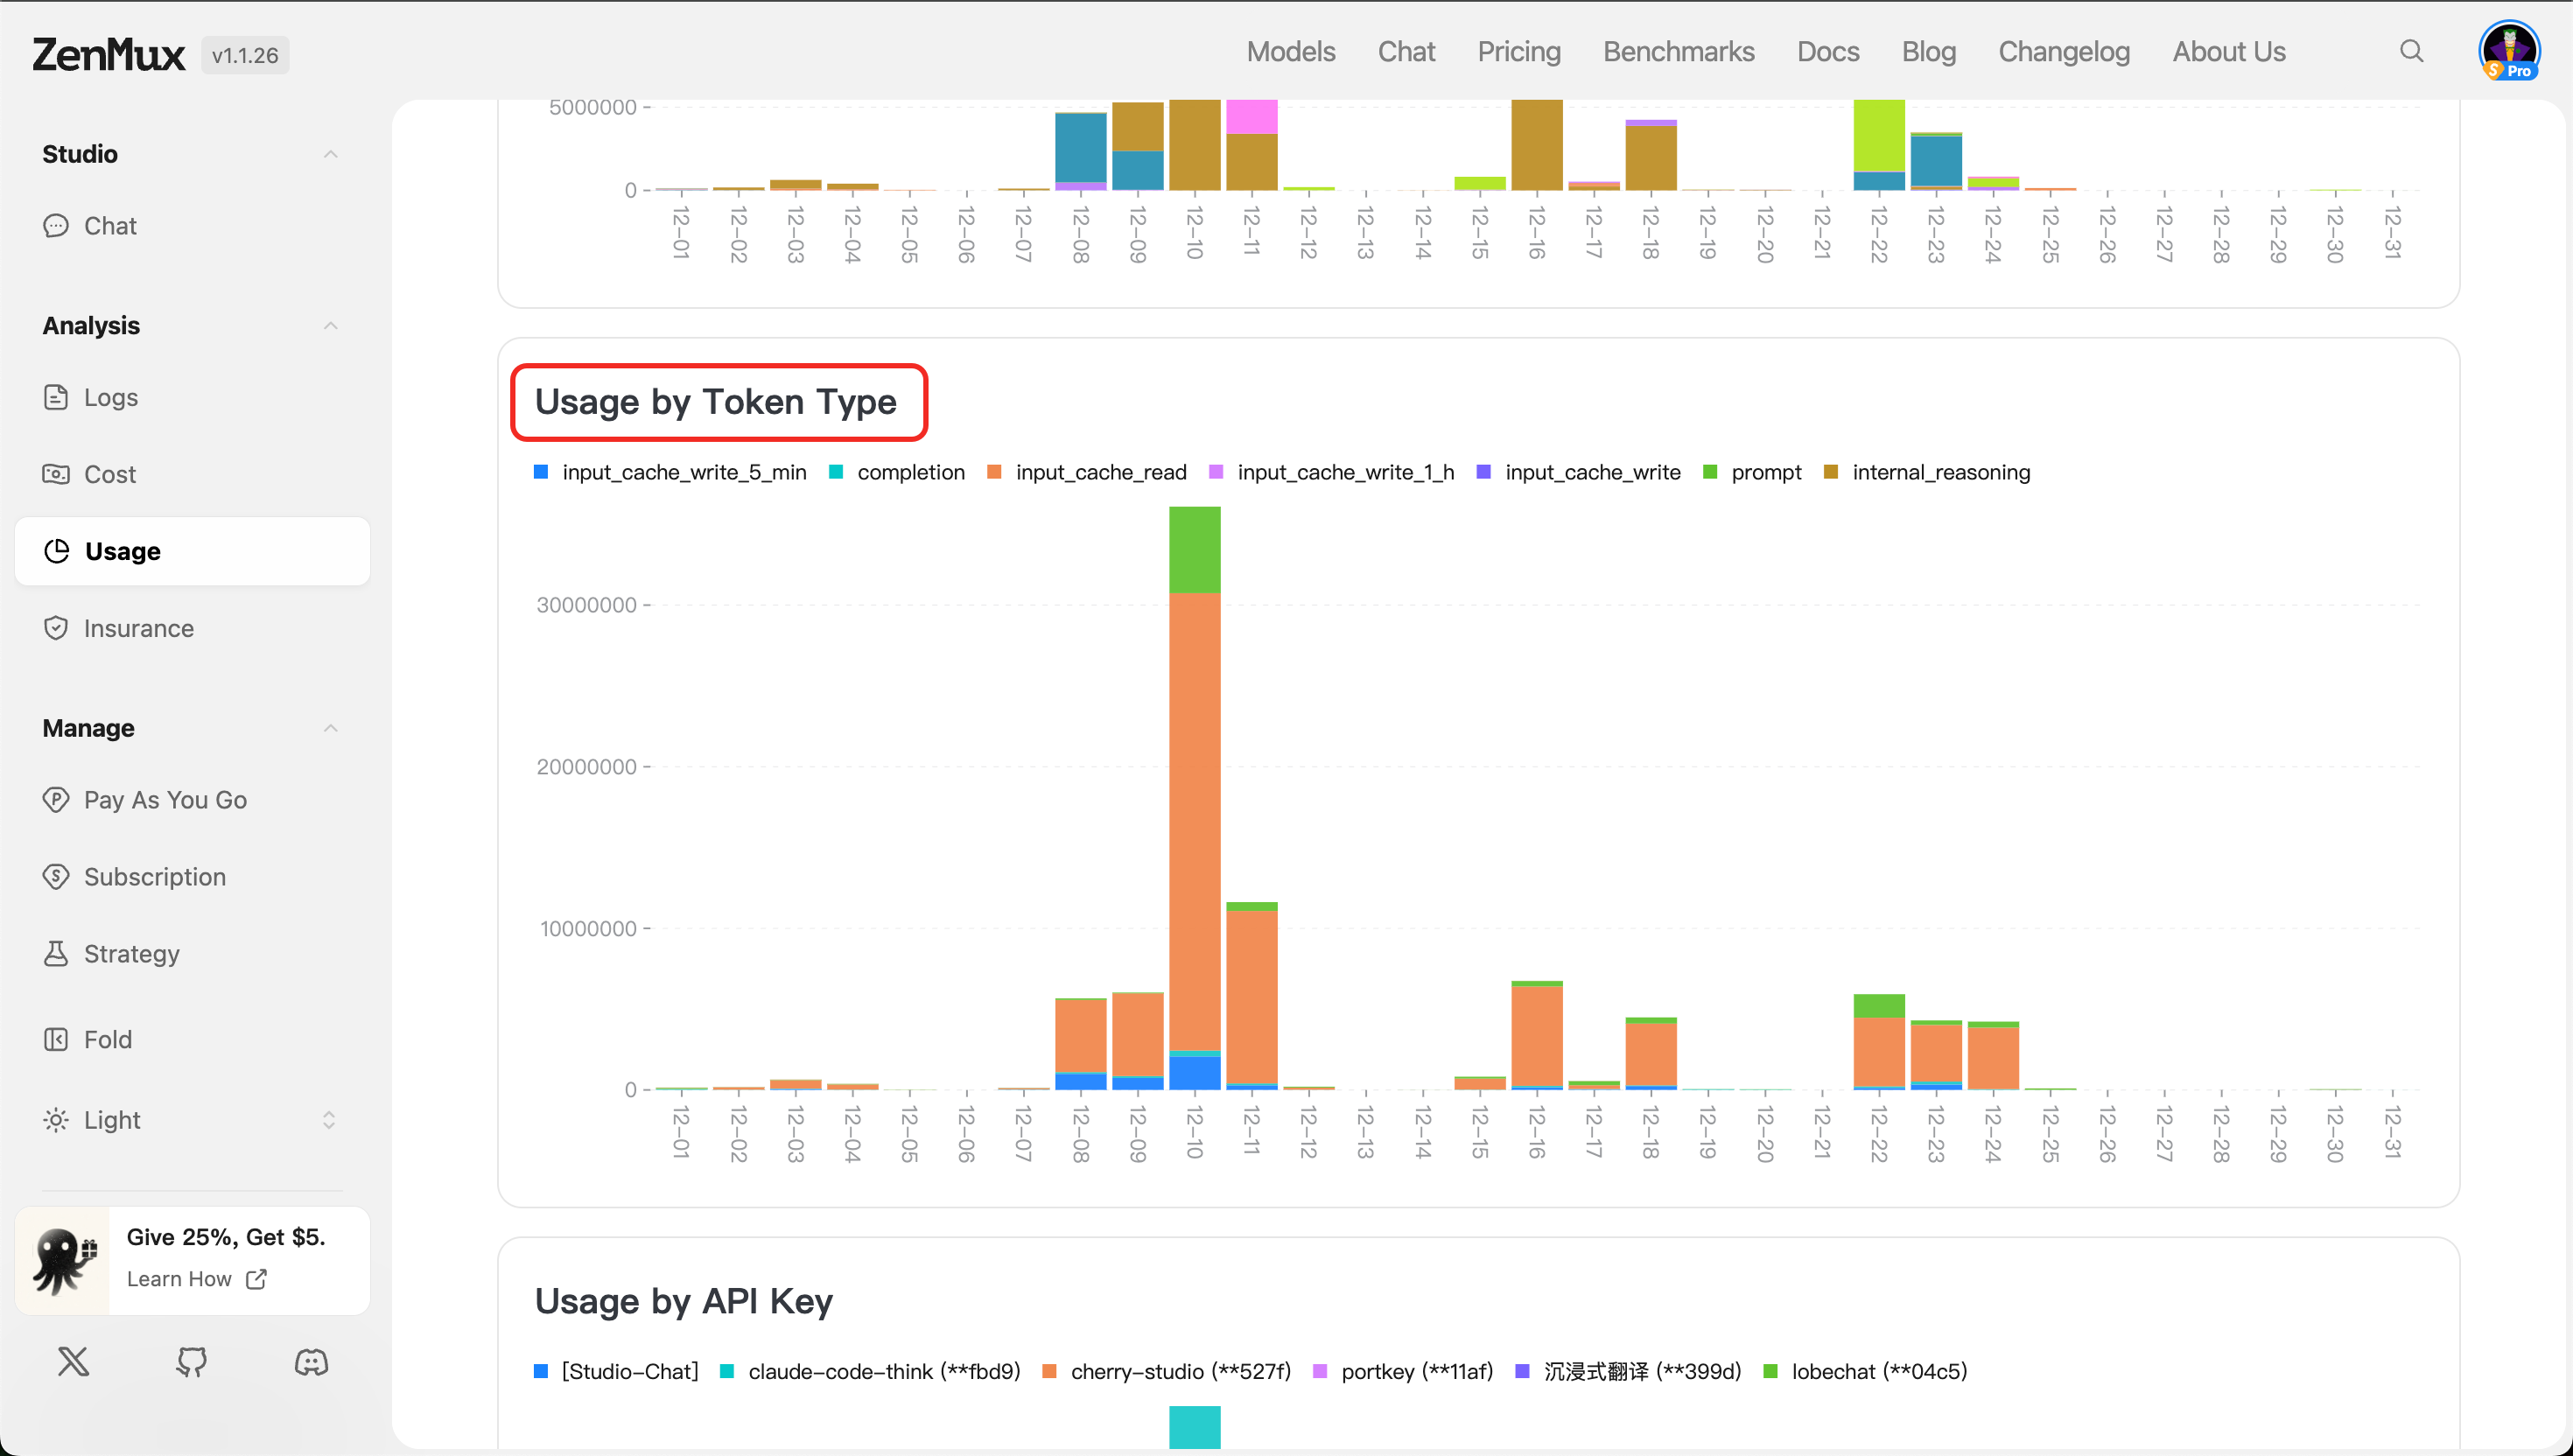
- Usage by API Key
Shows token and request usage across different API keys, suitable for usage isolation and auditing in multi-user or multi-project scenarios.
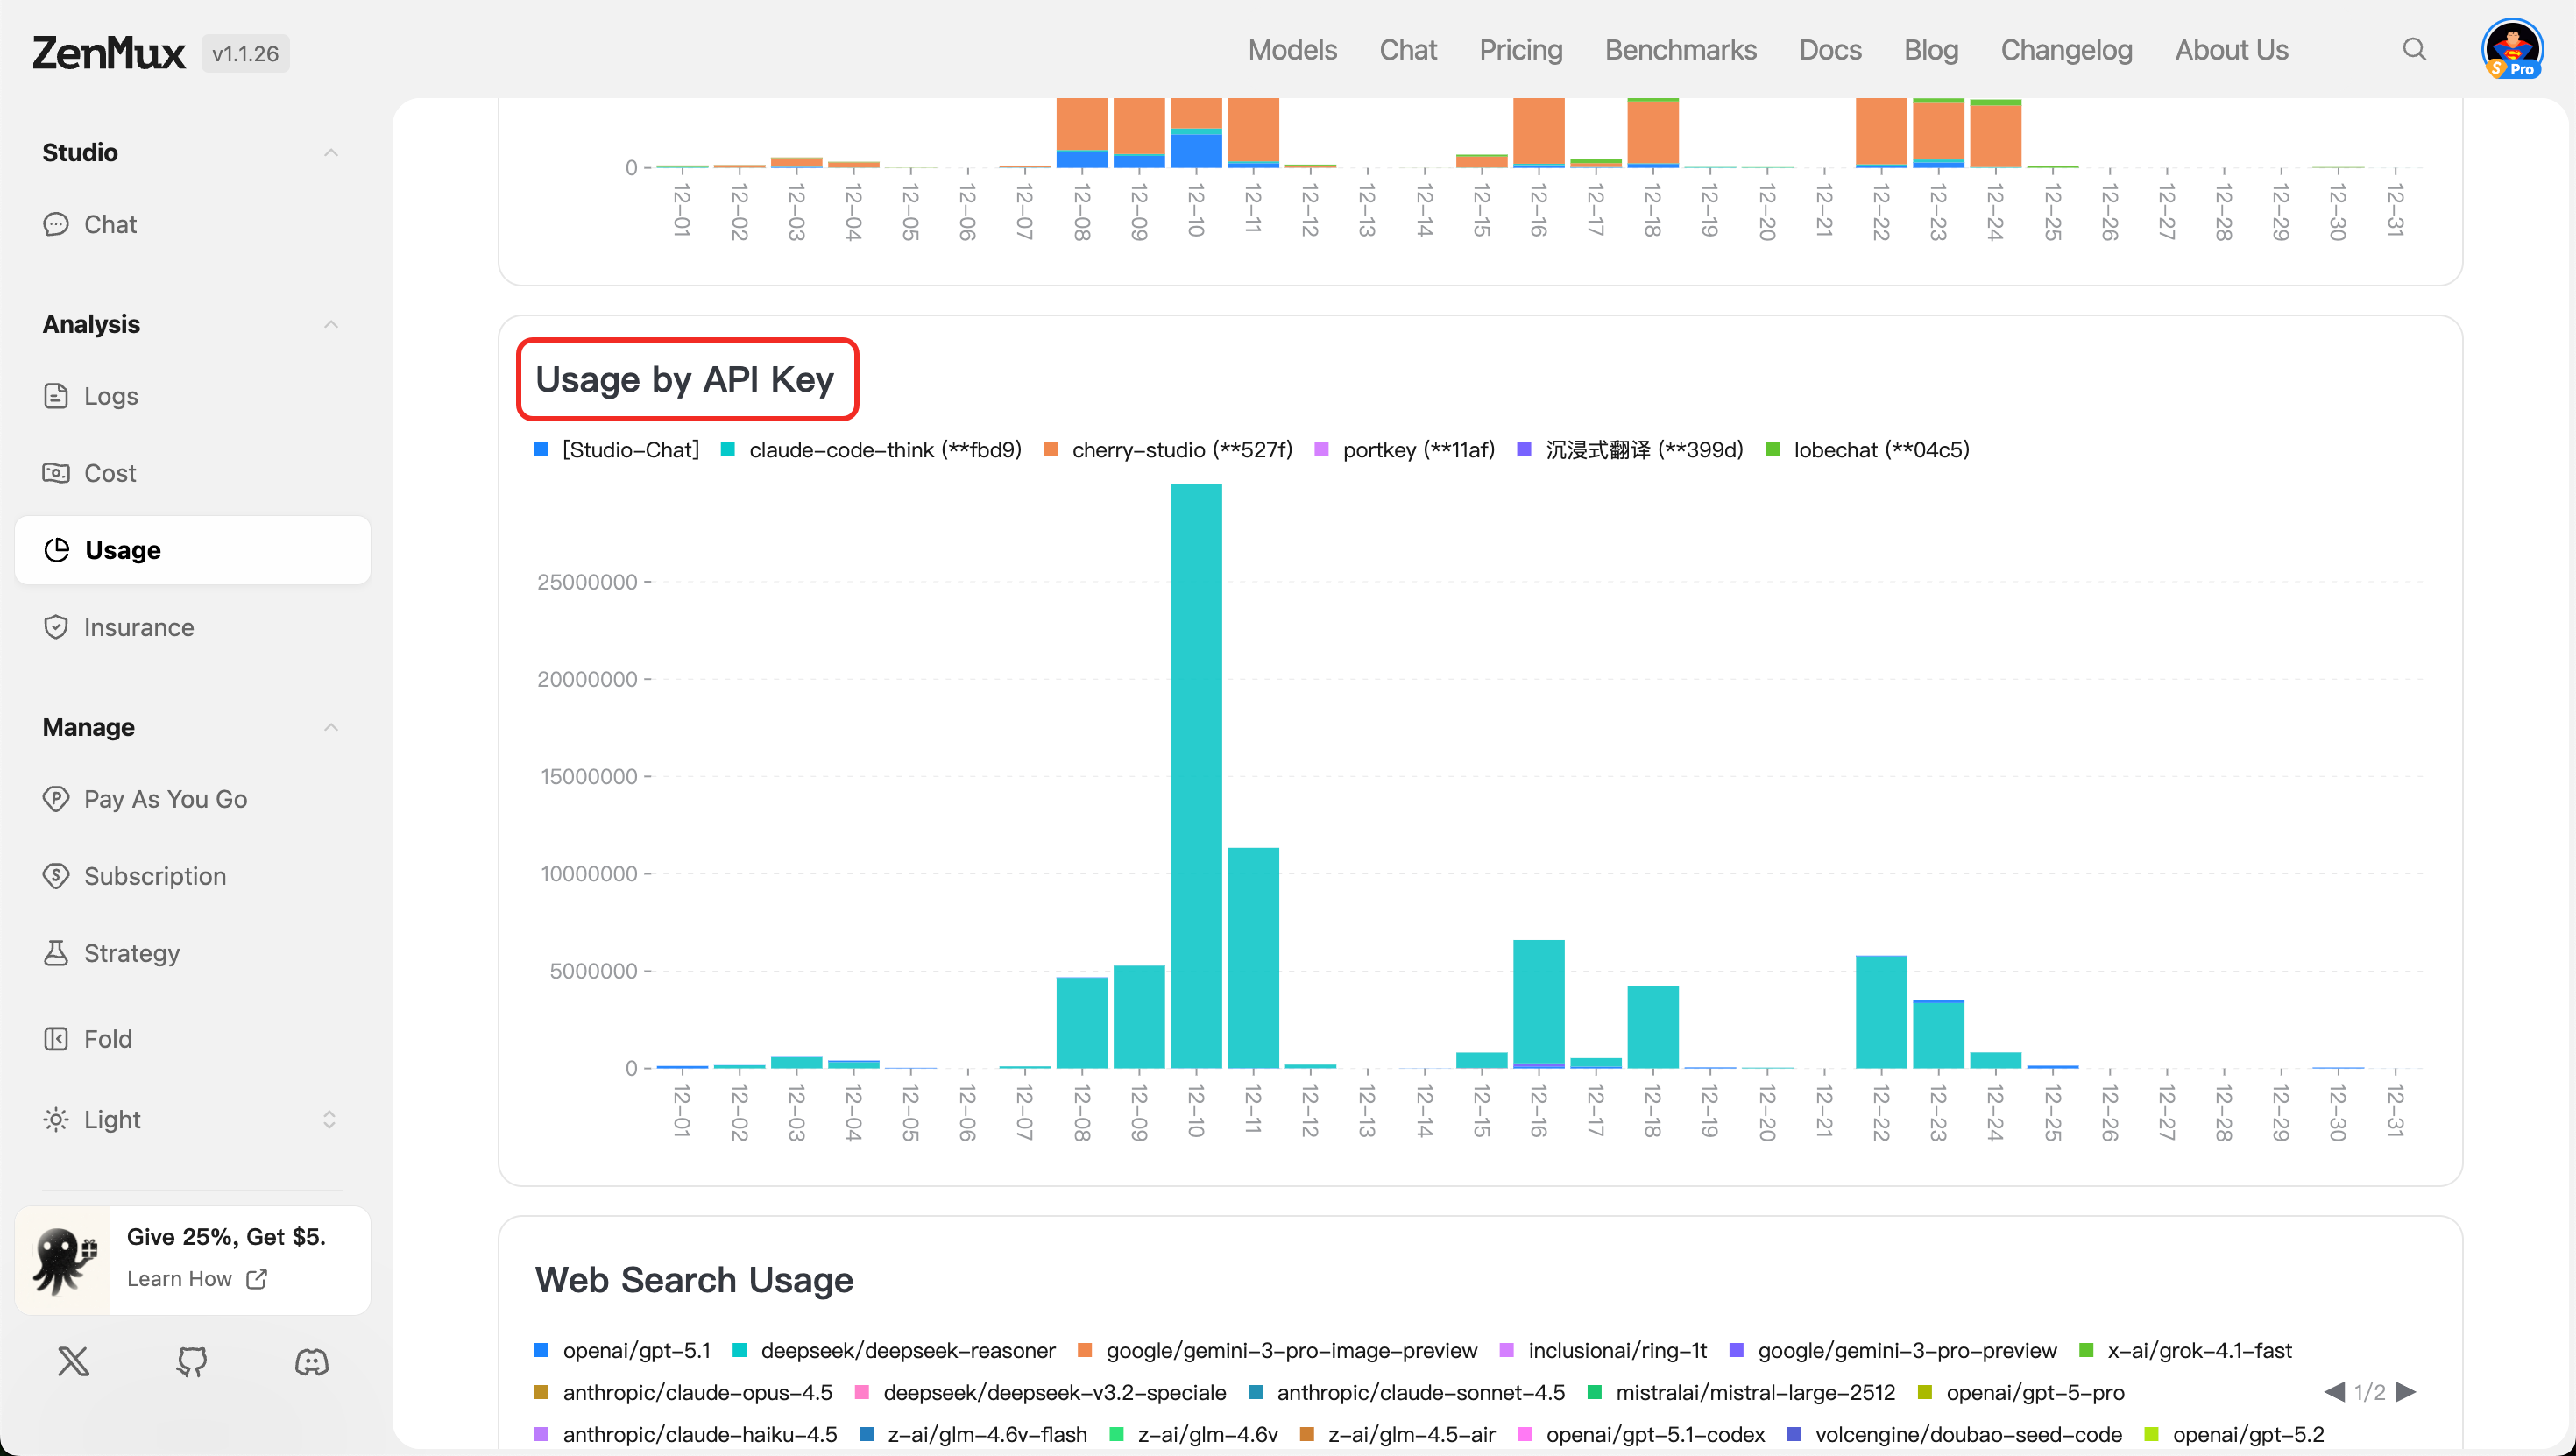
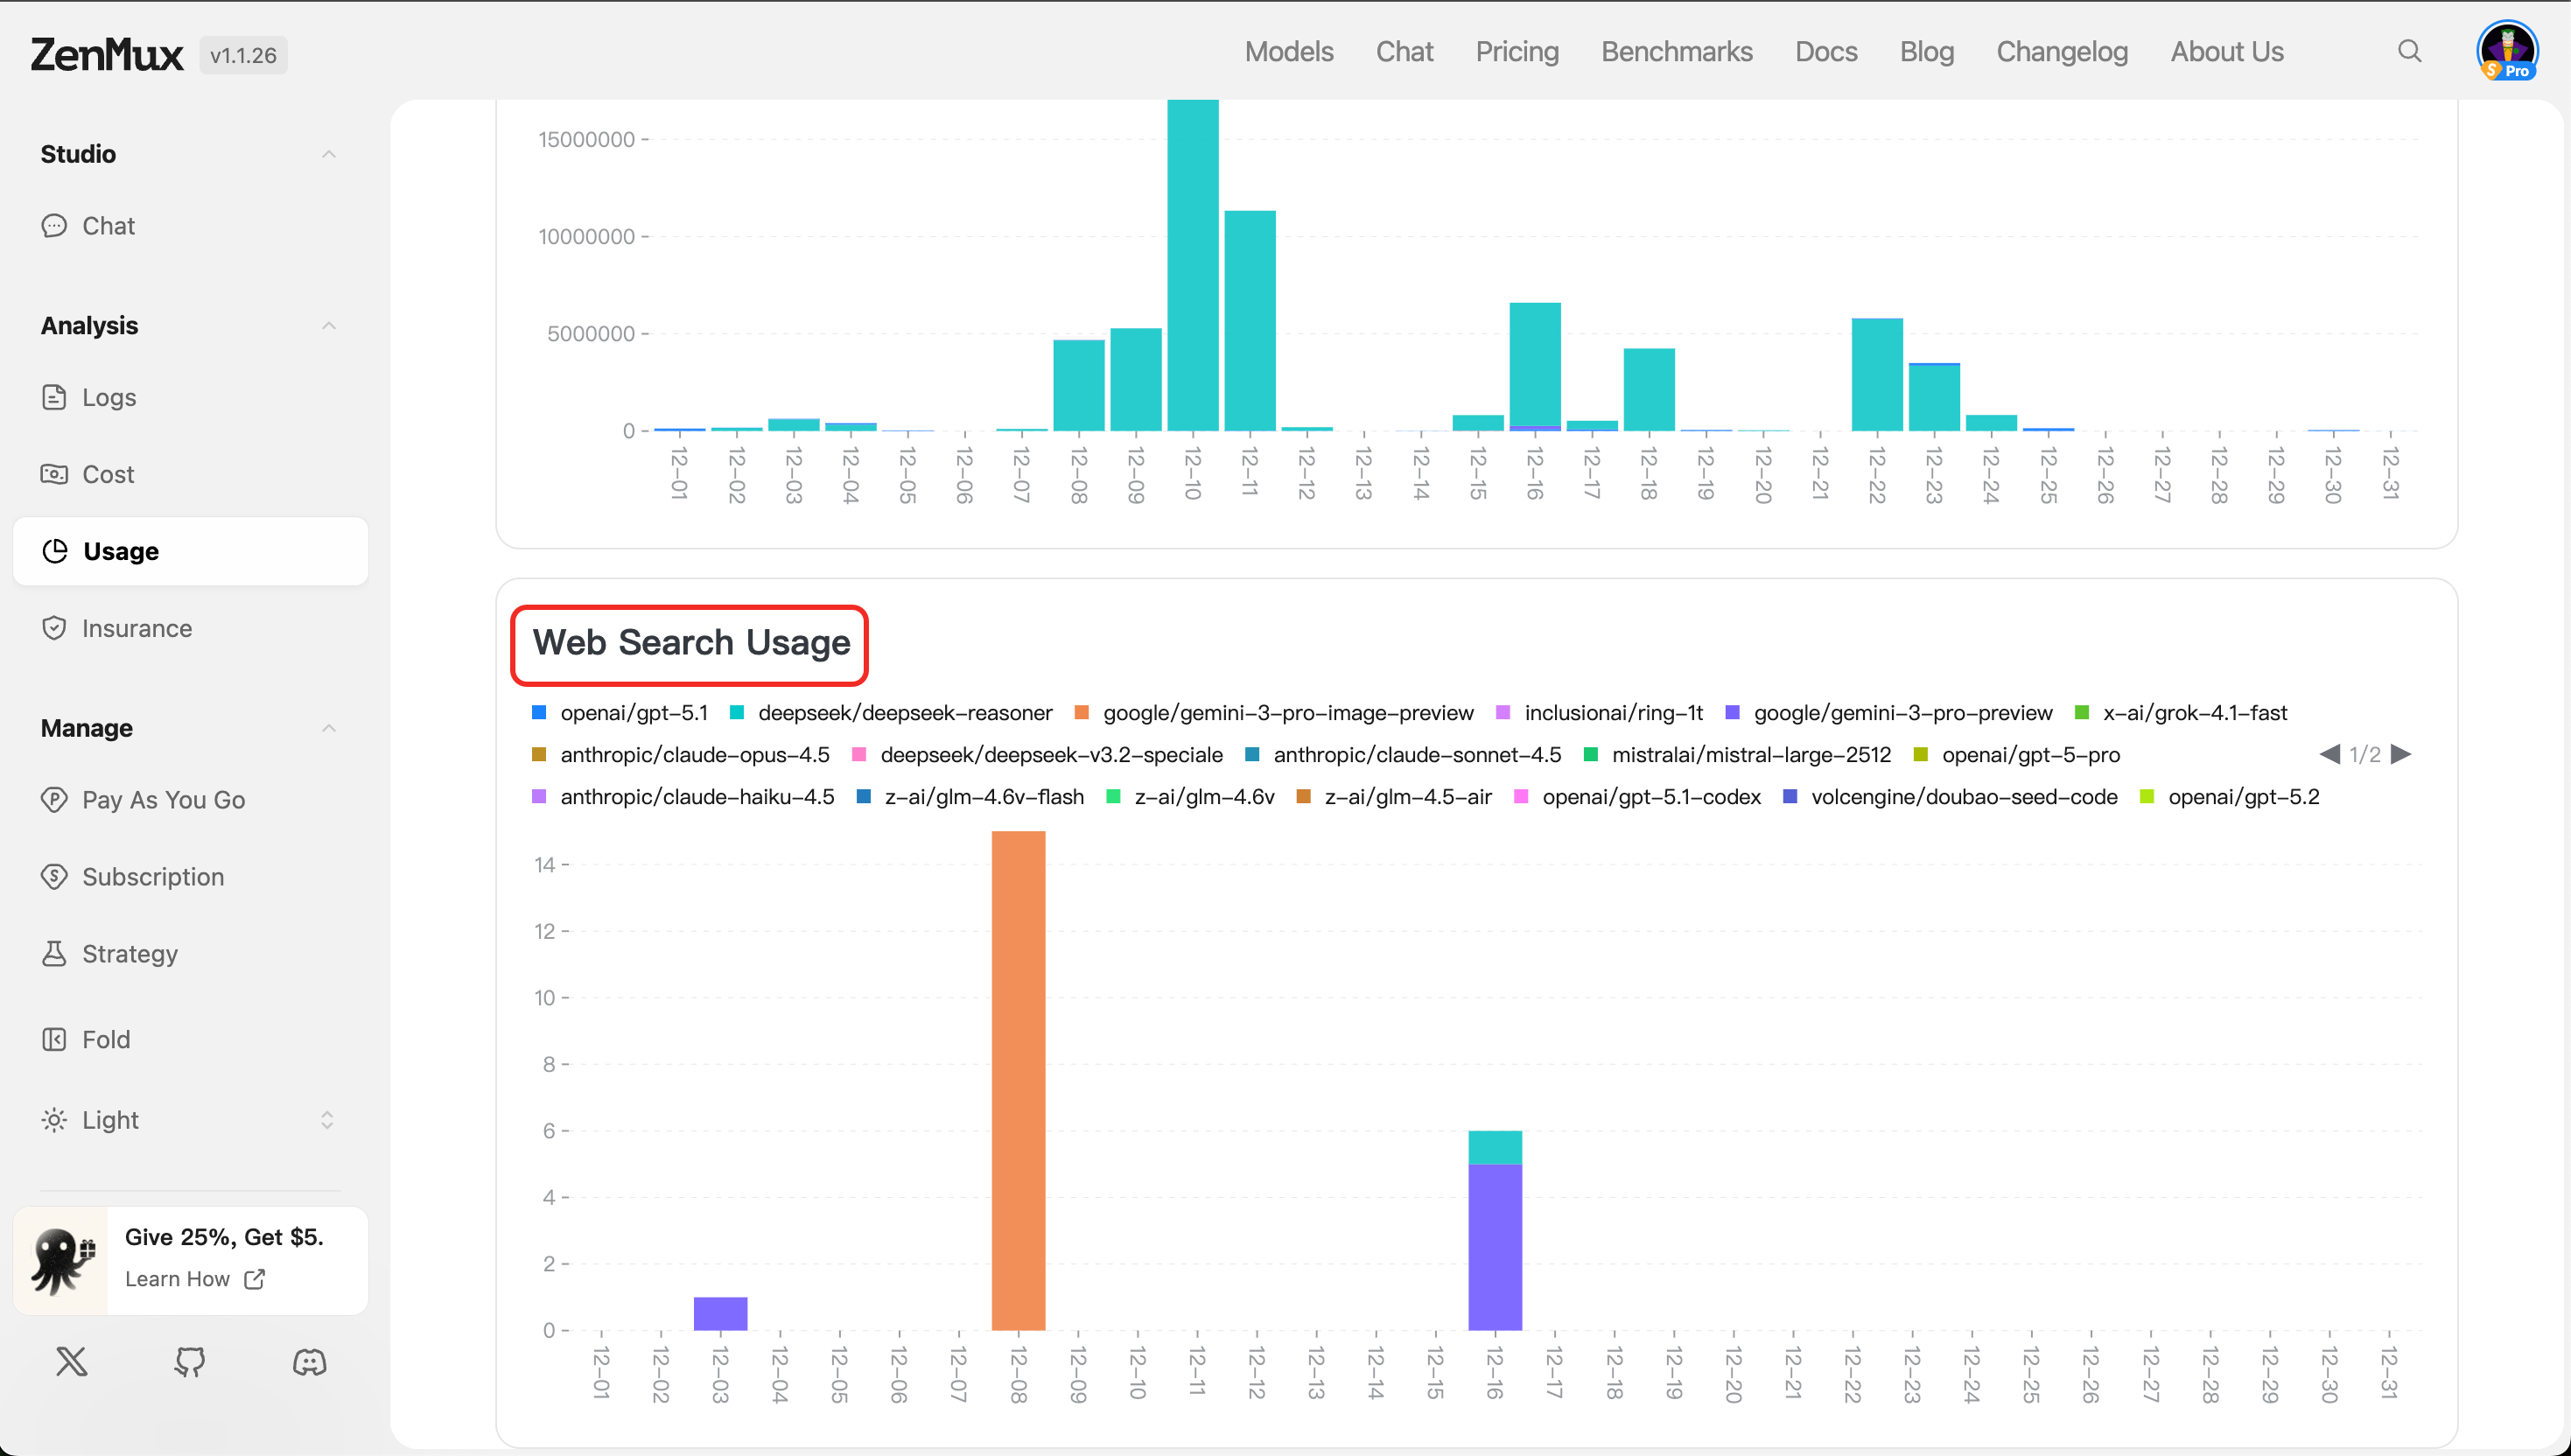
- Web Search Usage
Displays token consumption and call counts for requests with web search enabled (if applicable), helping assess the frequency and cost of enhanced retrieval features.
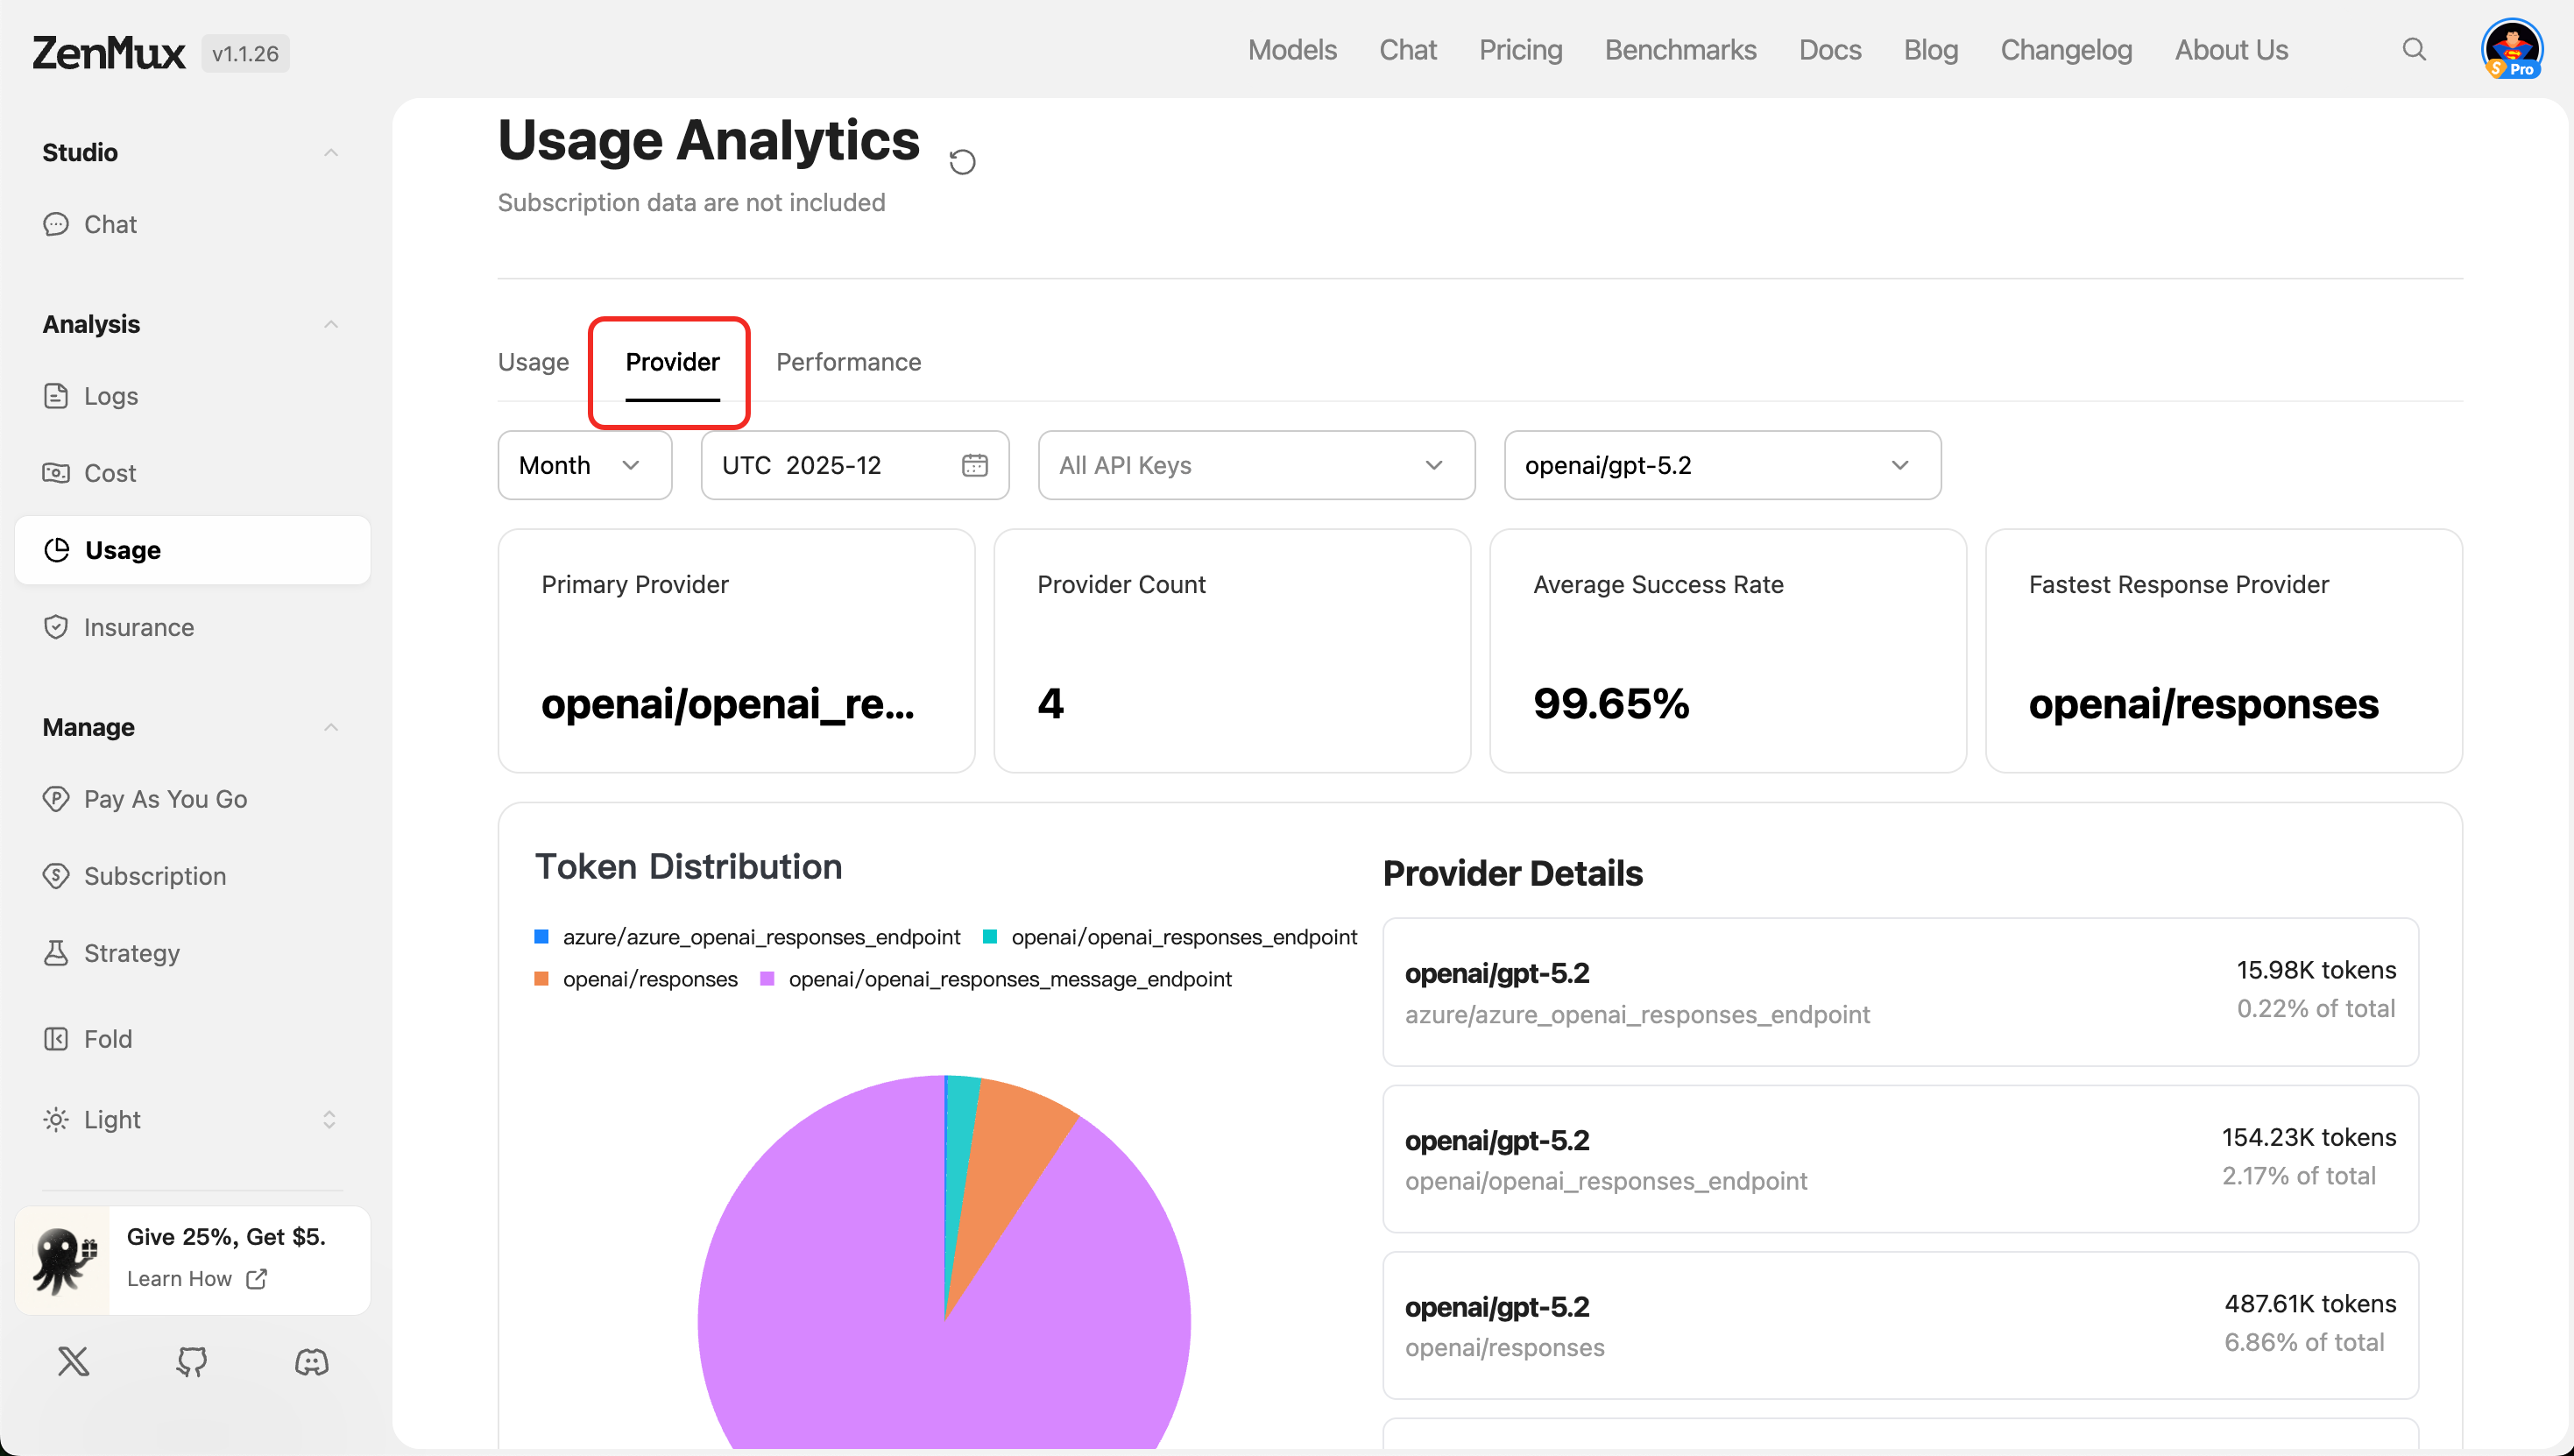
Provider
Switch to the "Provider" tab to view the performance of different AI service providers.
Metric Descriptions
| Metric | Description |
|---|---|
| Primary Provider | The primary AI service provider currently in use (e.g., Google Gemini, OpenAI, etc.). |
| Provider Count | Total number of service providers used. |
| Average Success Rate | Average success rate across all requests, reflecting service reliability. |
| Fastest Response Provider | The service provider with the shortest response time. |
Analysis by Dimension
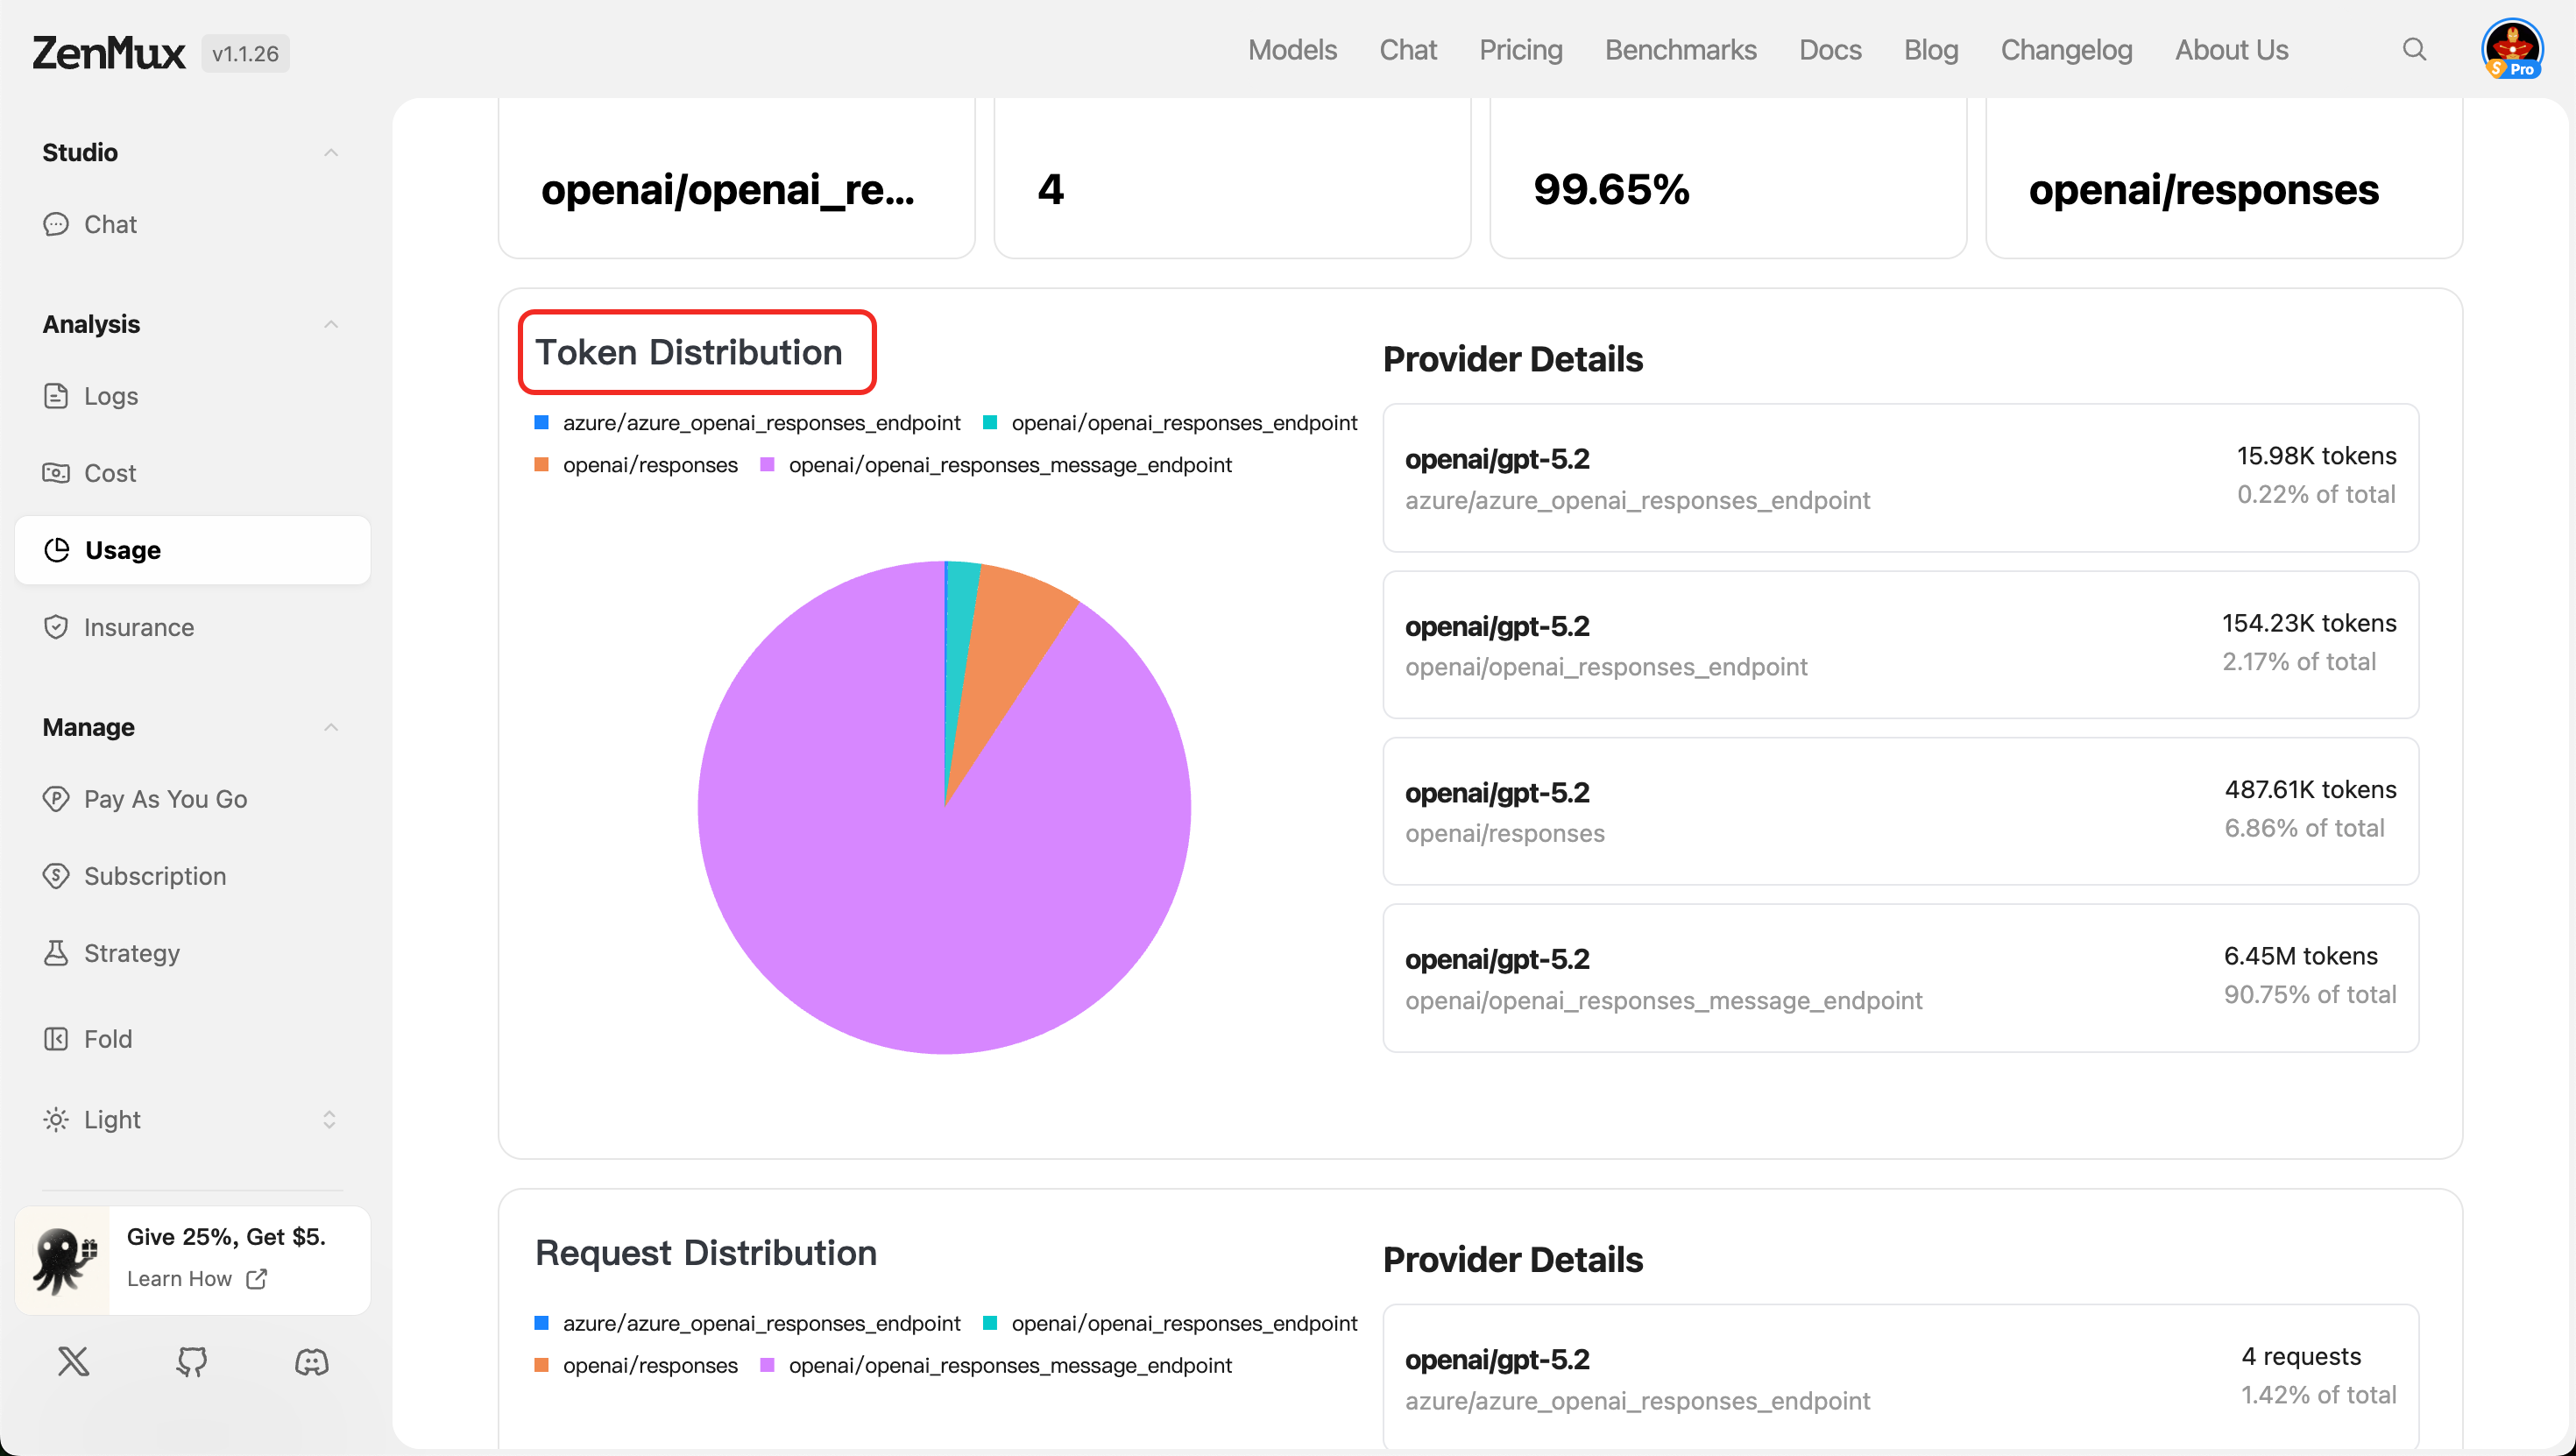
- Token Distribution
Shows token usage distribution across providers, making it easier to evaluate resource allocation efficiency.
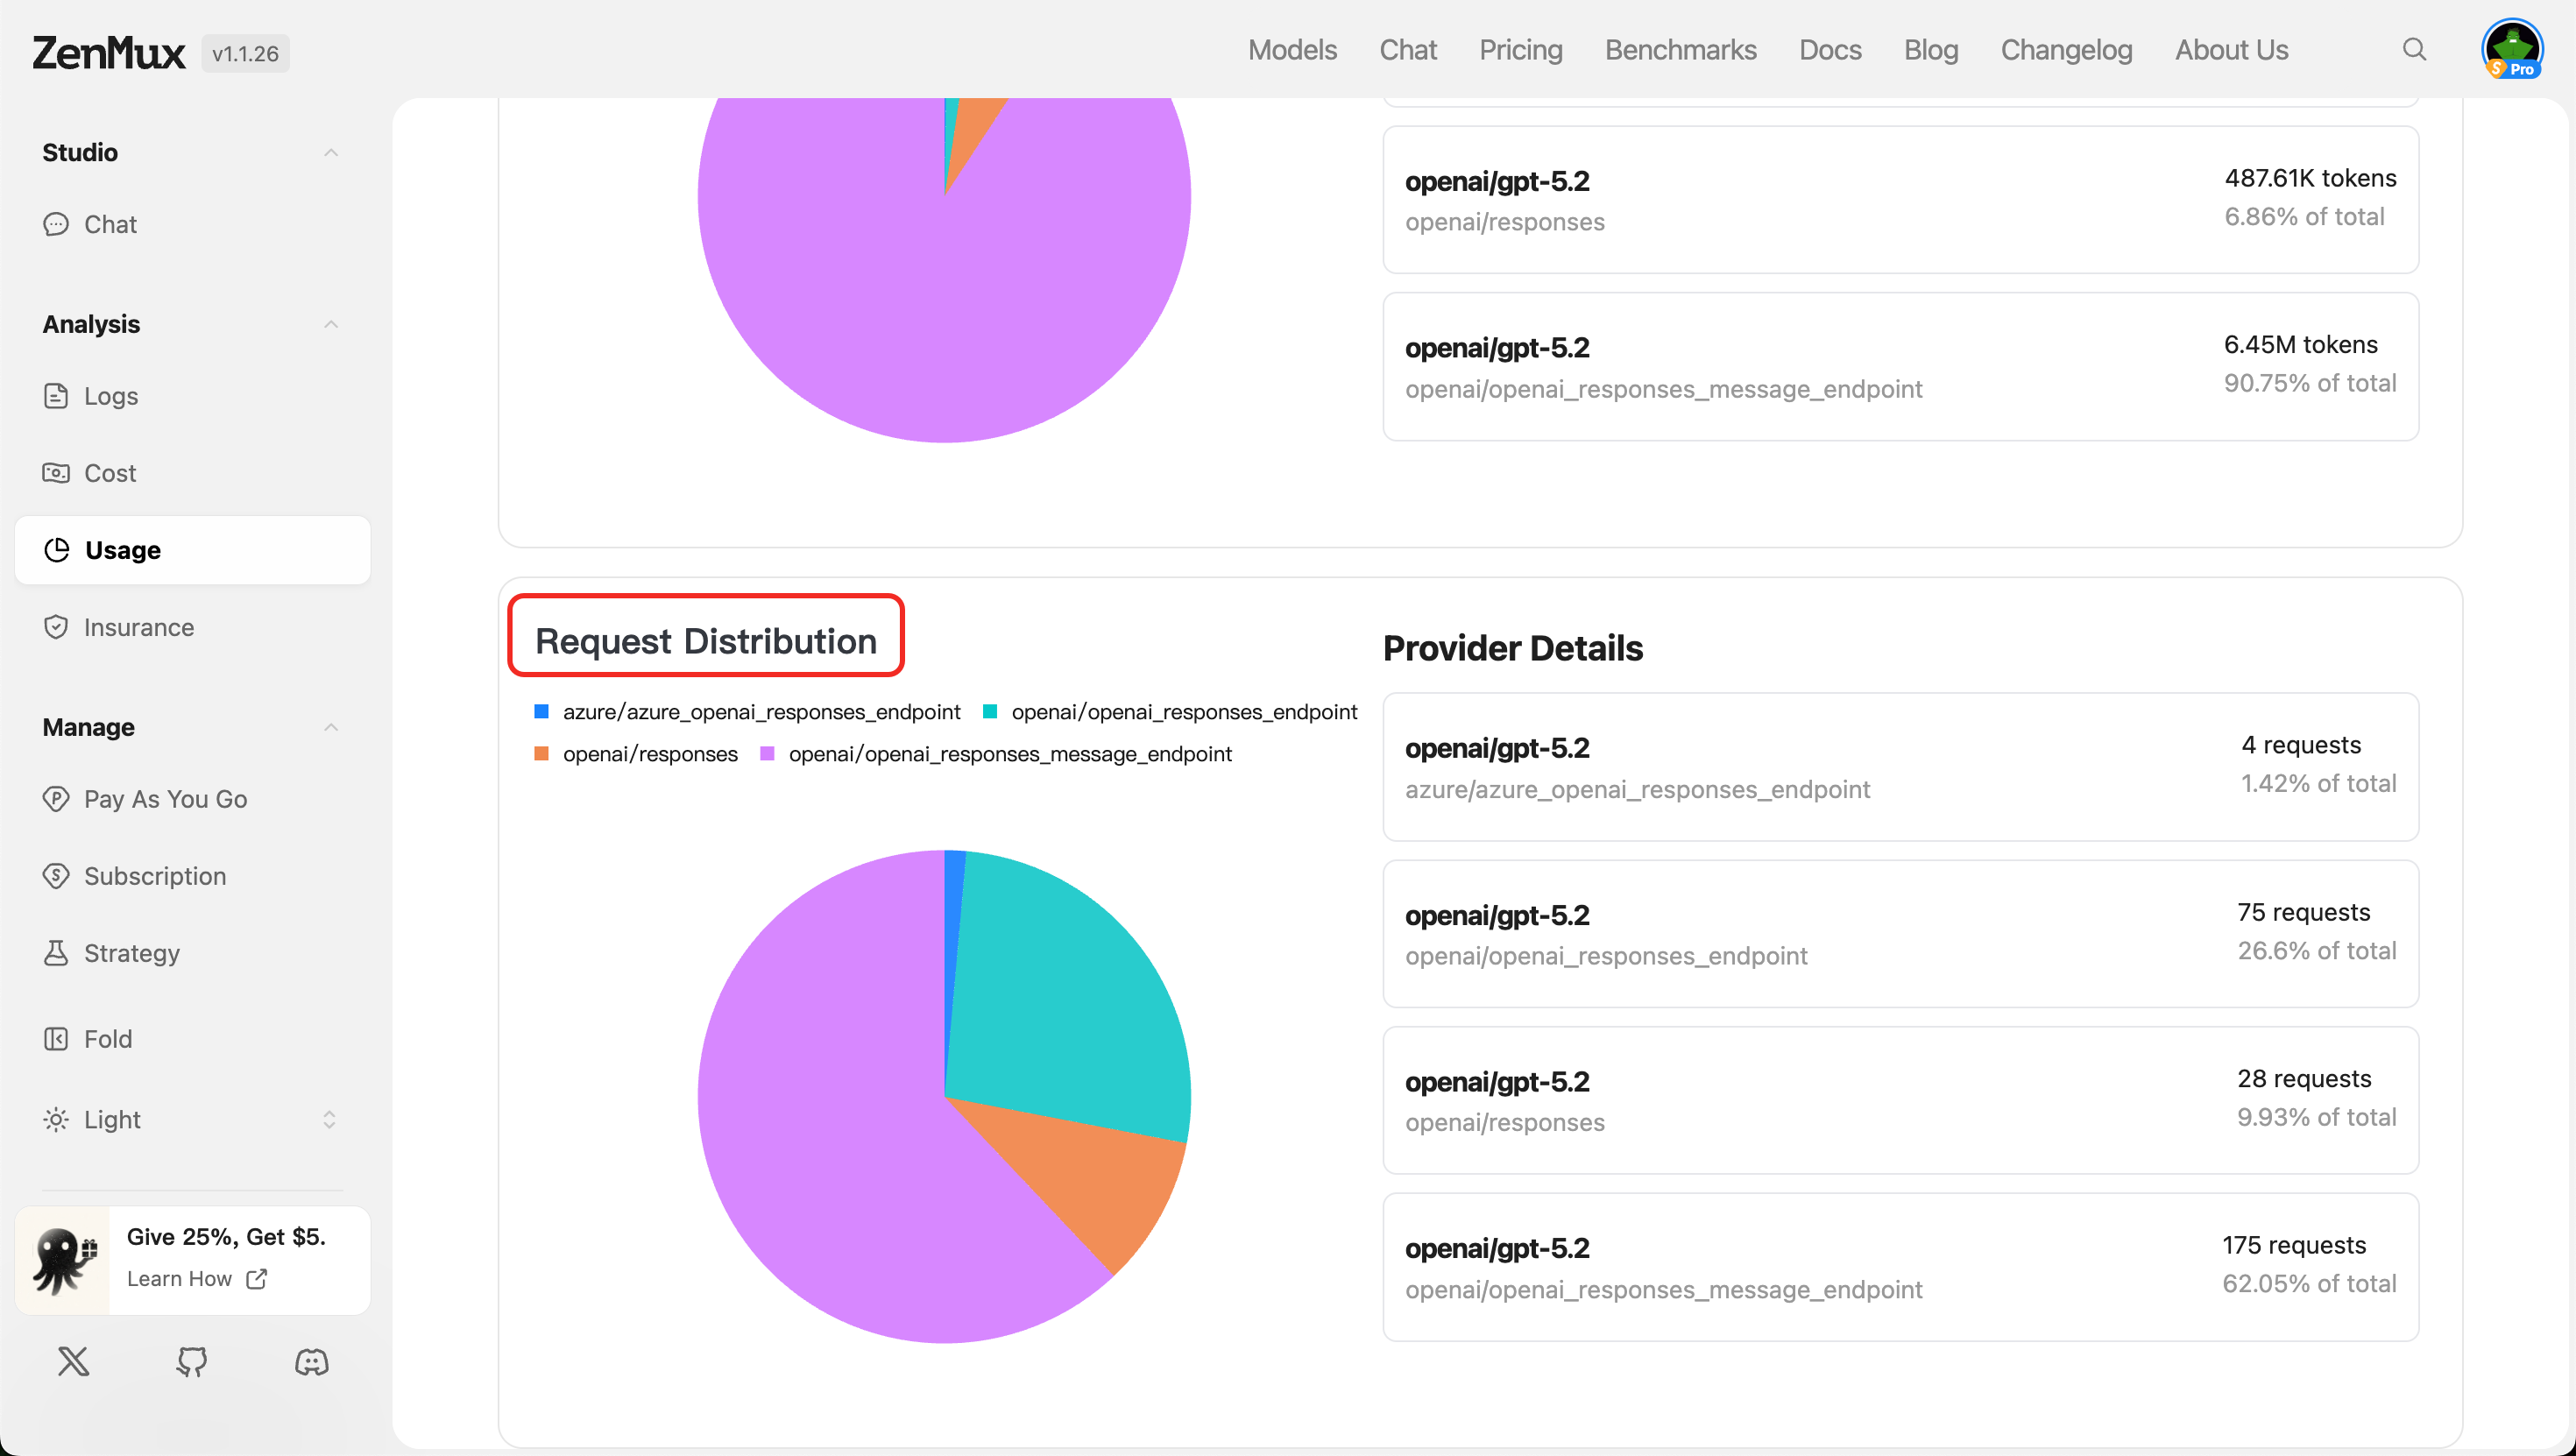
- Request Distribution
Displays API request count distribution by service provider, reflecting the call load for each provider.
Tip: Combine model and provider filters to perform in-depth analysis of specific combinations' performance.
Performance
In the "Performance" tab, you can view performance metrics for API calls to evaluate model response efficiency and service quality.
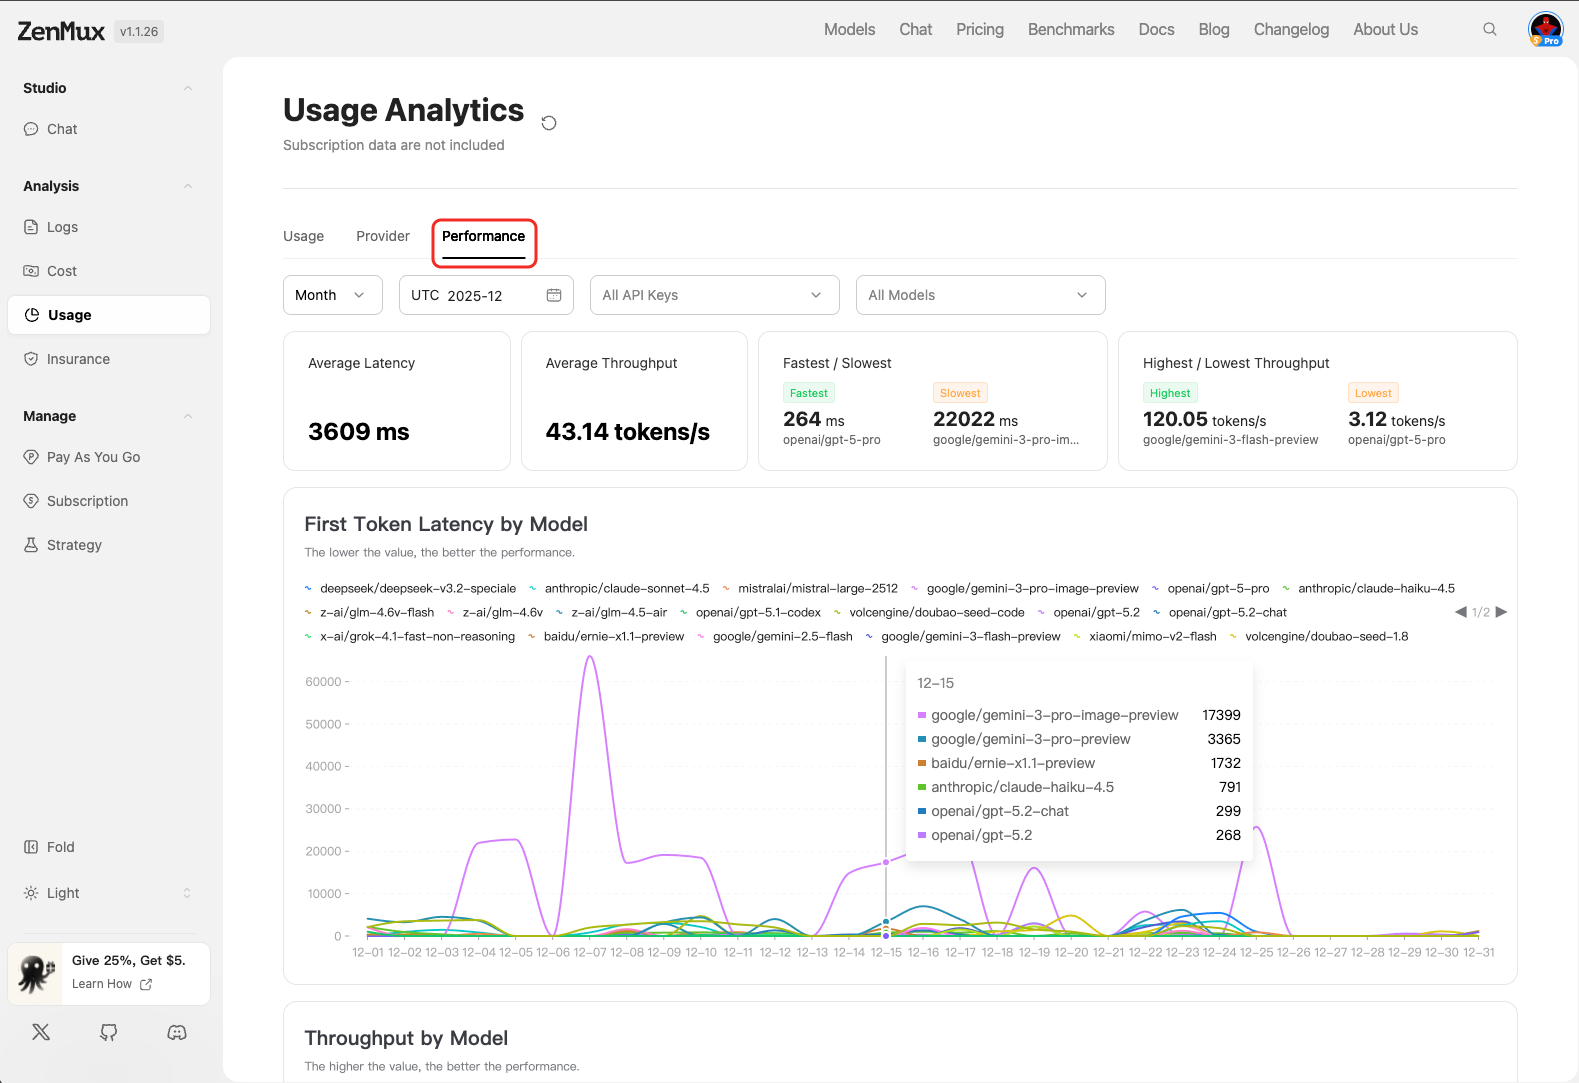
Metric Descriptions
| Metric | Description |
|---|---|
| Average Latency | Average response latency in milliseconds; lower values indicate faster responses. |
| Average Throughput | Average throughput in tokens per second, reflecting processing capacity per unit time. |
| Fastest / Slowest | Lists the fastest and slowest model response records, helping identify performance bottlenecks. |
| Highest / Lowest Throughput | Shows models with the highest and lowest throughput, assisting with load balancing optimization. |
Analysis by Model
First Token Latency by Model
Displays the latency for generating the first token across different models.Note: First token latency is a critical user experience metric; lower values indicate more responsive performance.
- Displays latency distribution across models in charts or lists.
- Supports filtering by model to quickly identify high-latency models.
Throughput by Model
Displays throughput (tokens per second) across different models.Note: The higher the value, the better the performance.
- Used for comparing processing efficiency across models within a given timeframe.
- Helps select high-throughput models to improve overall system responsiveness.
Contact Us
If you encounter any issues or have suggestions and feedback, feel free to reach out to us:
- Official Website: https://zenmux.ai
- Technical Support Email: [email protected]
- Business Inquiries: [email protected]
- Twitter: @ZenMuxAI
- Discord Community: http://discord.gg/vHZZzj84Bm
For more contact information and details, please visit our Contact Us page.